Desktop app · Mac and Windows

From floor video to a balanced line

Turn floor video or stopwatch readings into a Yamazumi chart, station by station. See value-add, required work and waste against takt, balance the line and share the standard work. Your videos and study data stay on your computer.

Mac (M1+) and Windows 10/11
How it works

From measurement to standard in three steps

Measurement, decision and standard in one window; you never move data from one tool to the next.

  1. 1

    Measure

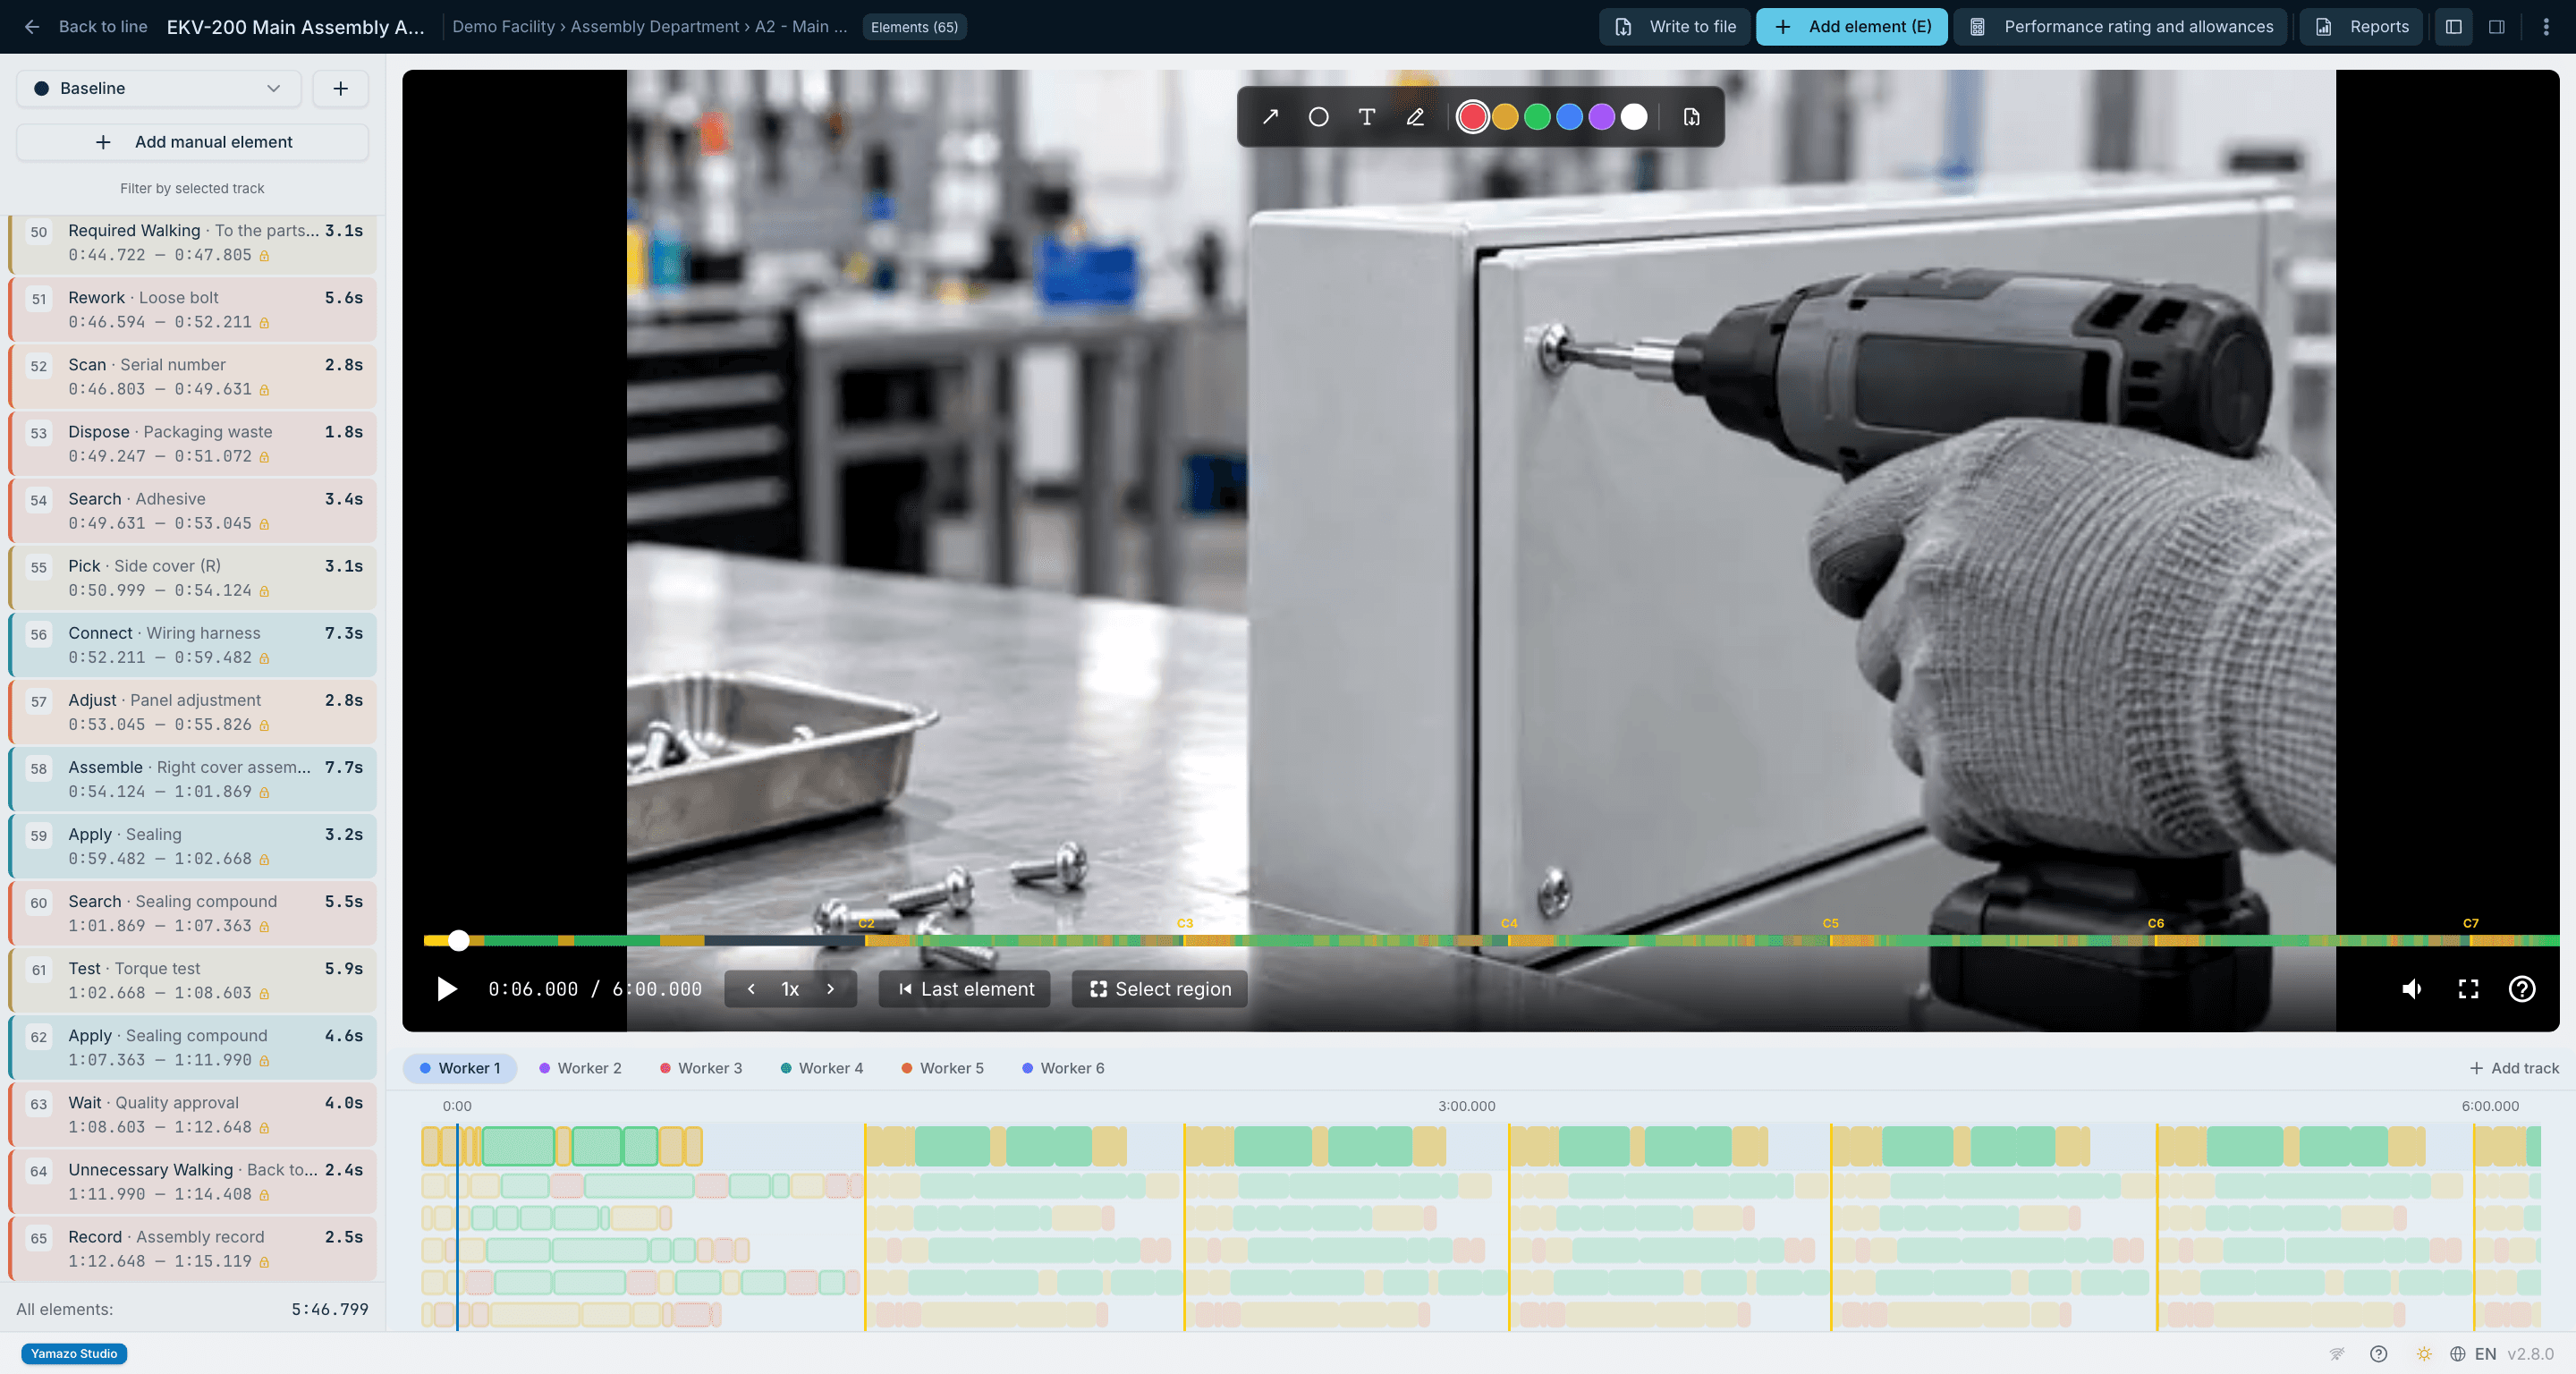
    Step through floor video frame by frame, or time it with Studio's stopwatch; mark exactly where each work step starts and ends.

  2. 2

    Balance

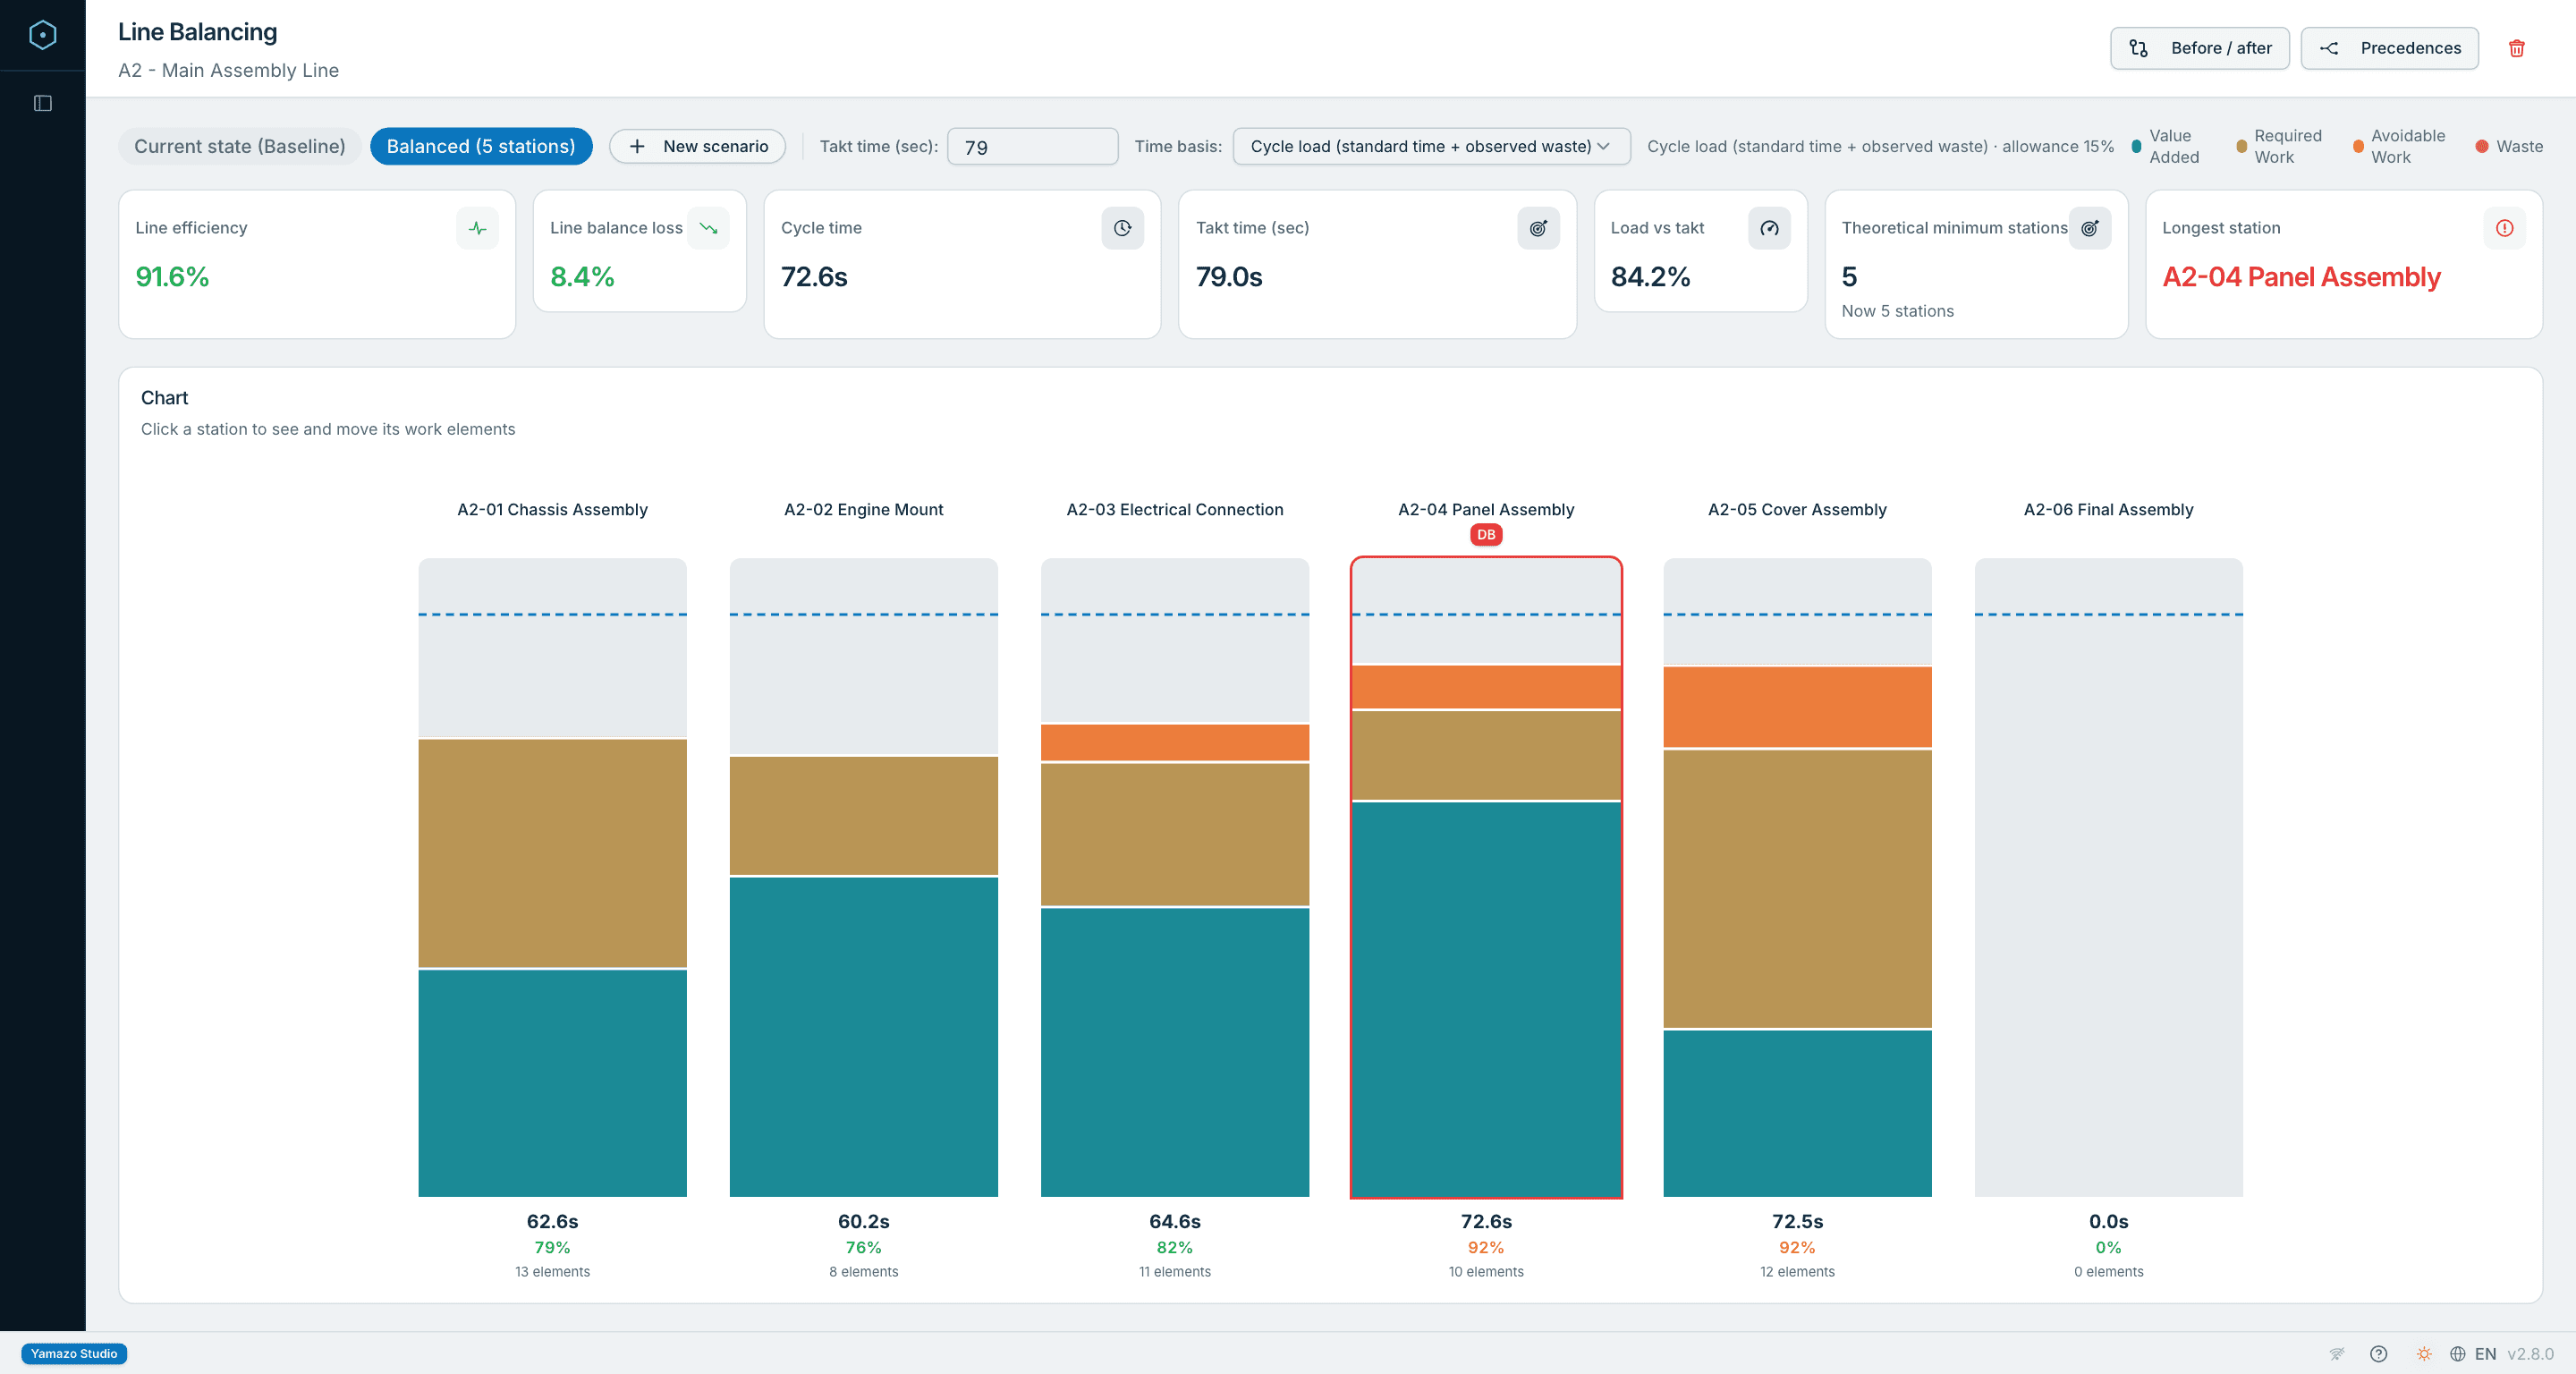
    See every station against takt on the Yamazumi; build balancing scenarios and compare them.

  3. 3

    Standardise

    Share work instructions, A3s and reports as PDF, Excel or CSV.

From frame-accurate video analysis to VSM, Yamazumi, A3 Kaizen, Workforce and Standard Work — all in one window. For teams, Airlock adds time data management on your own network.

Lean Operating Desk

Featured modules

See it in motion

Multi-Track Operations — Human & Machine Together
Model operator and machine work in parallel: unlimited tracking lanes, a dedicated colour per lane, real-time visualisation of simultaneous operations. In human–machine studies, who works when can be read from where the lanes overlap.
SOT (Standard Operating Time) Analysis
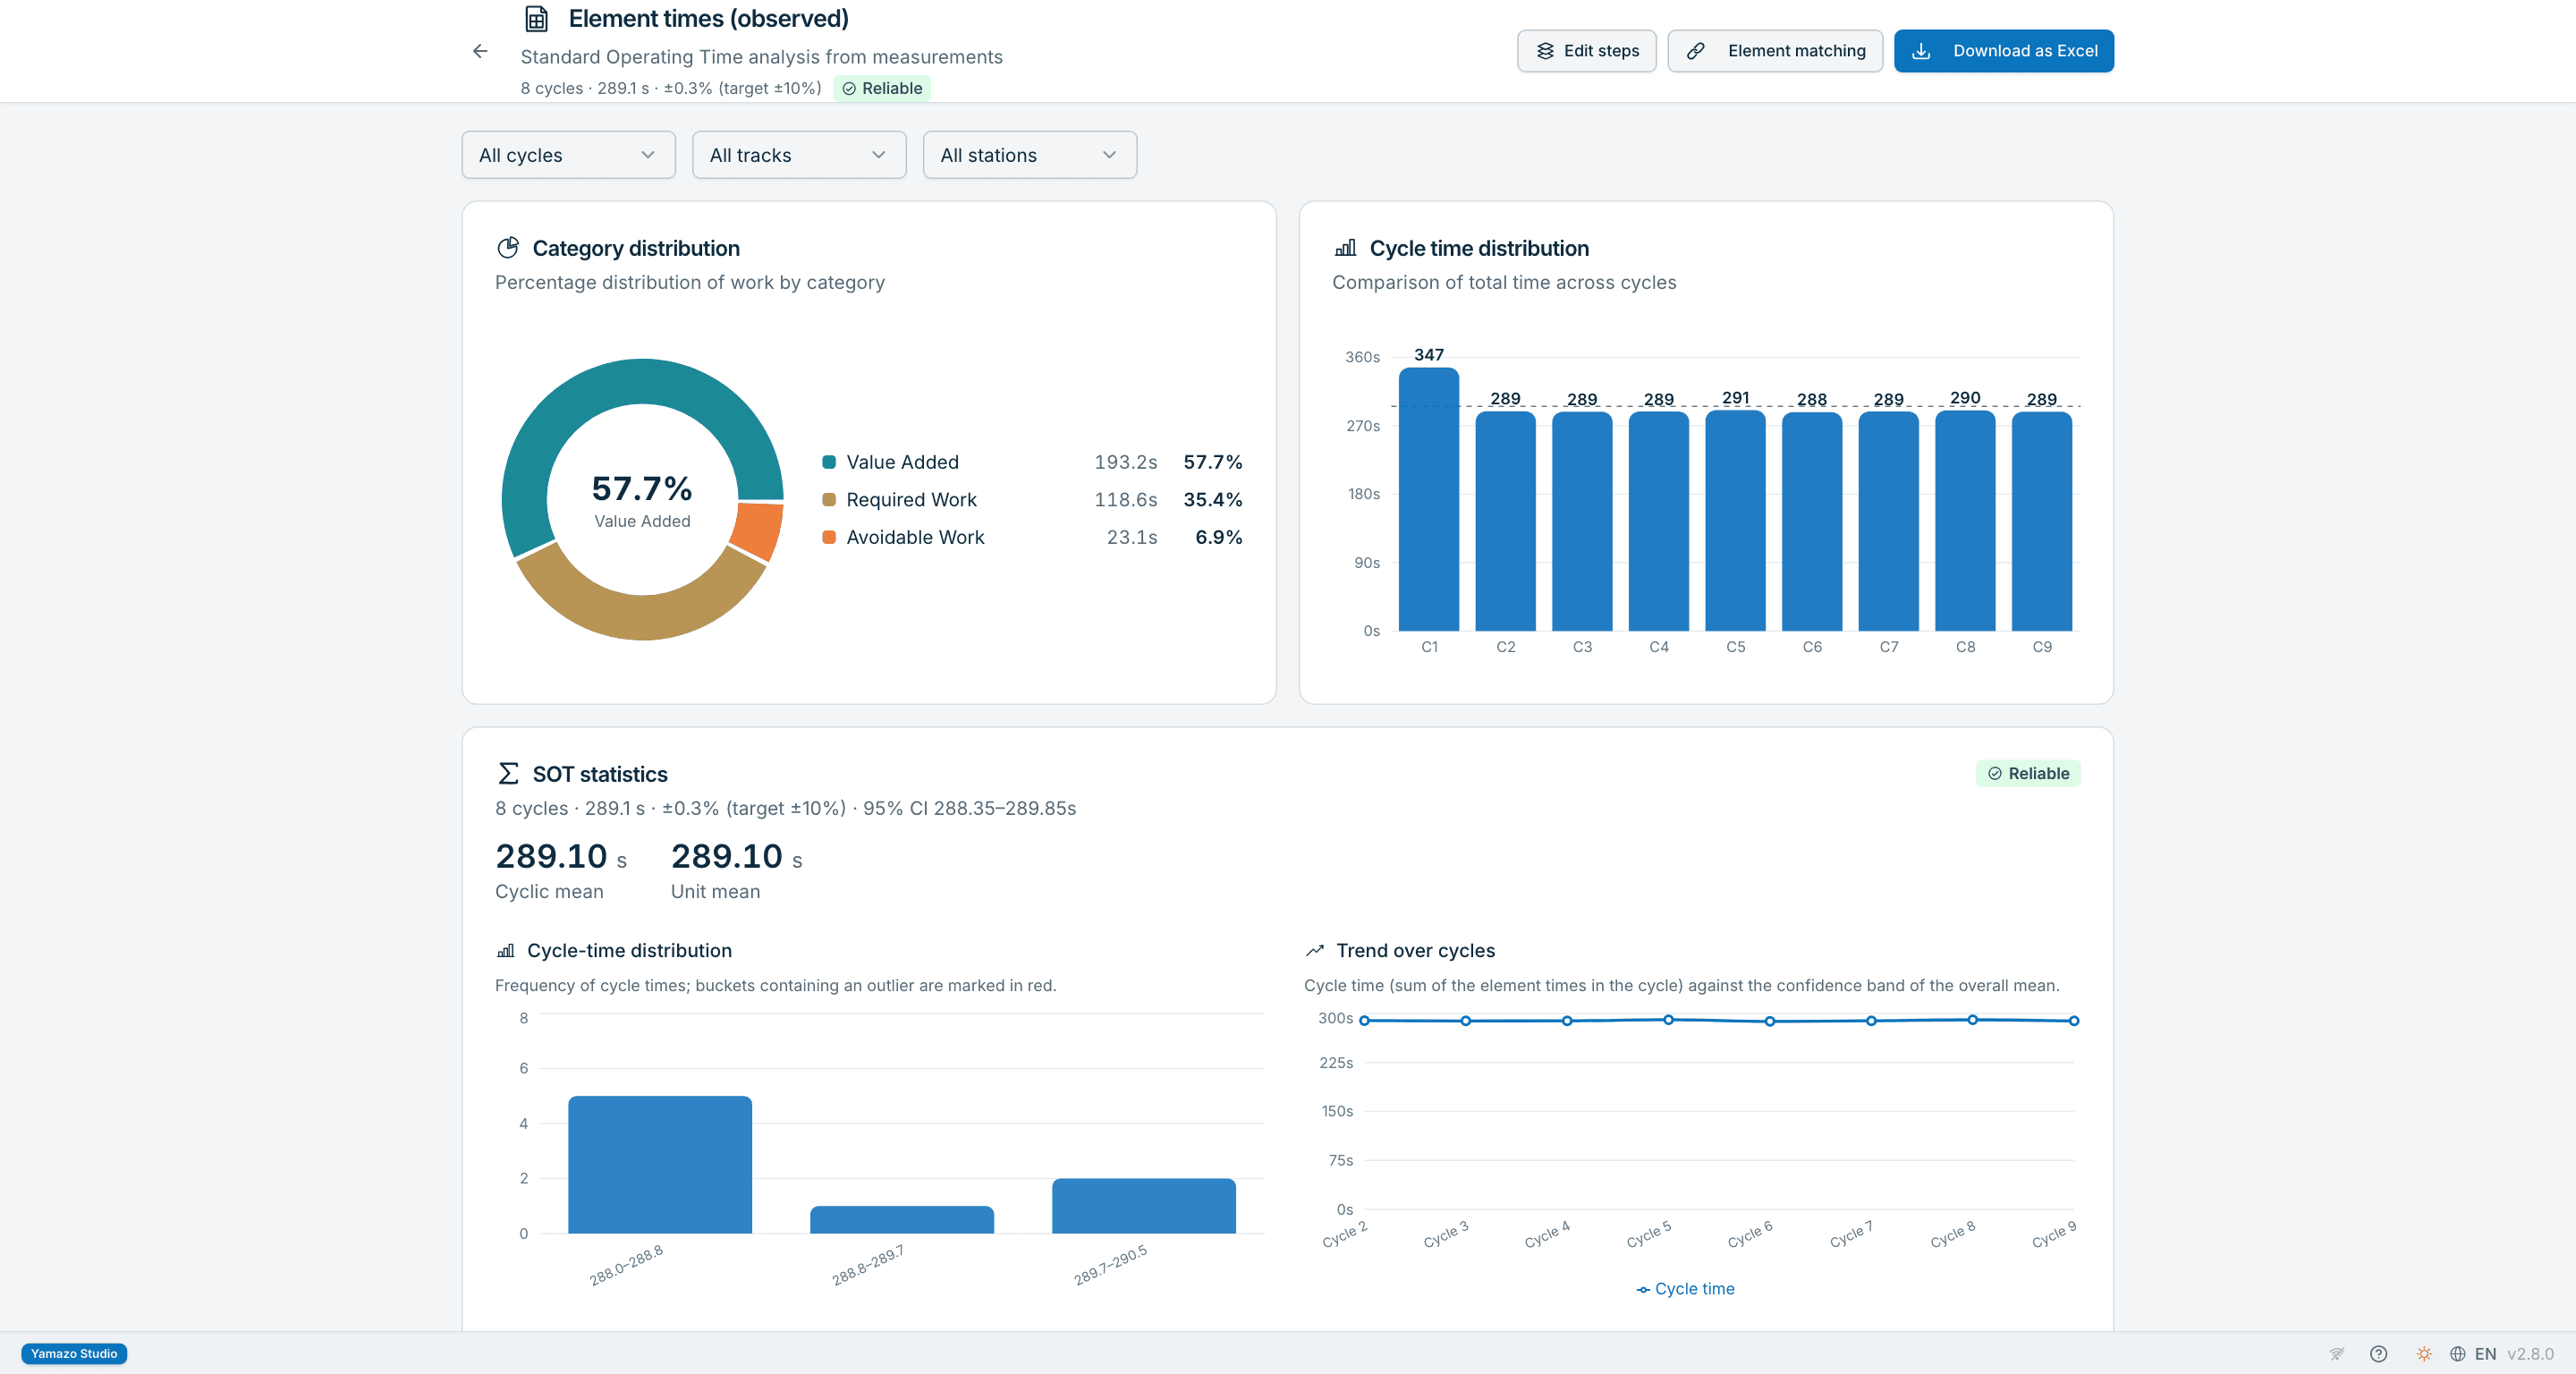
Multi-dimensional time analysis by station, operator, process, work area and verb category; per cycle average, minimum and maximum. Export to Excel. You see in one table which dimension takes most of the time.
Measured Precision
Every study reports the precision it carries, for example 8 cycles · 319.3 s · ±0.4%, and says from the measured spread how many cycles reach the target precision. The data decides, not a fixed cycle count. You know how precisely you can defend a time in the meeting.
Automatic Yamazumi Charts
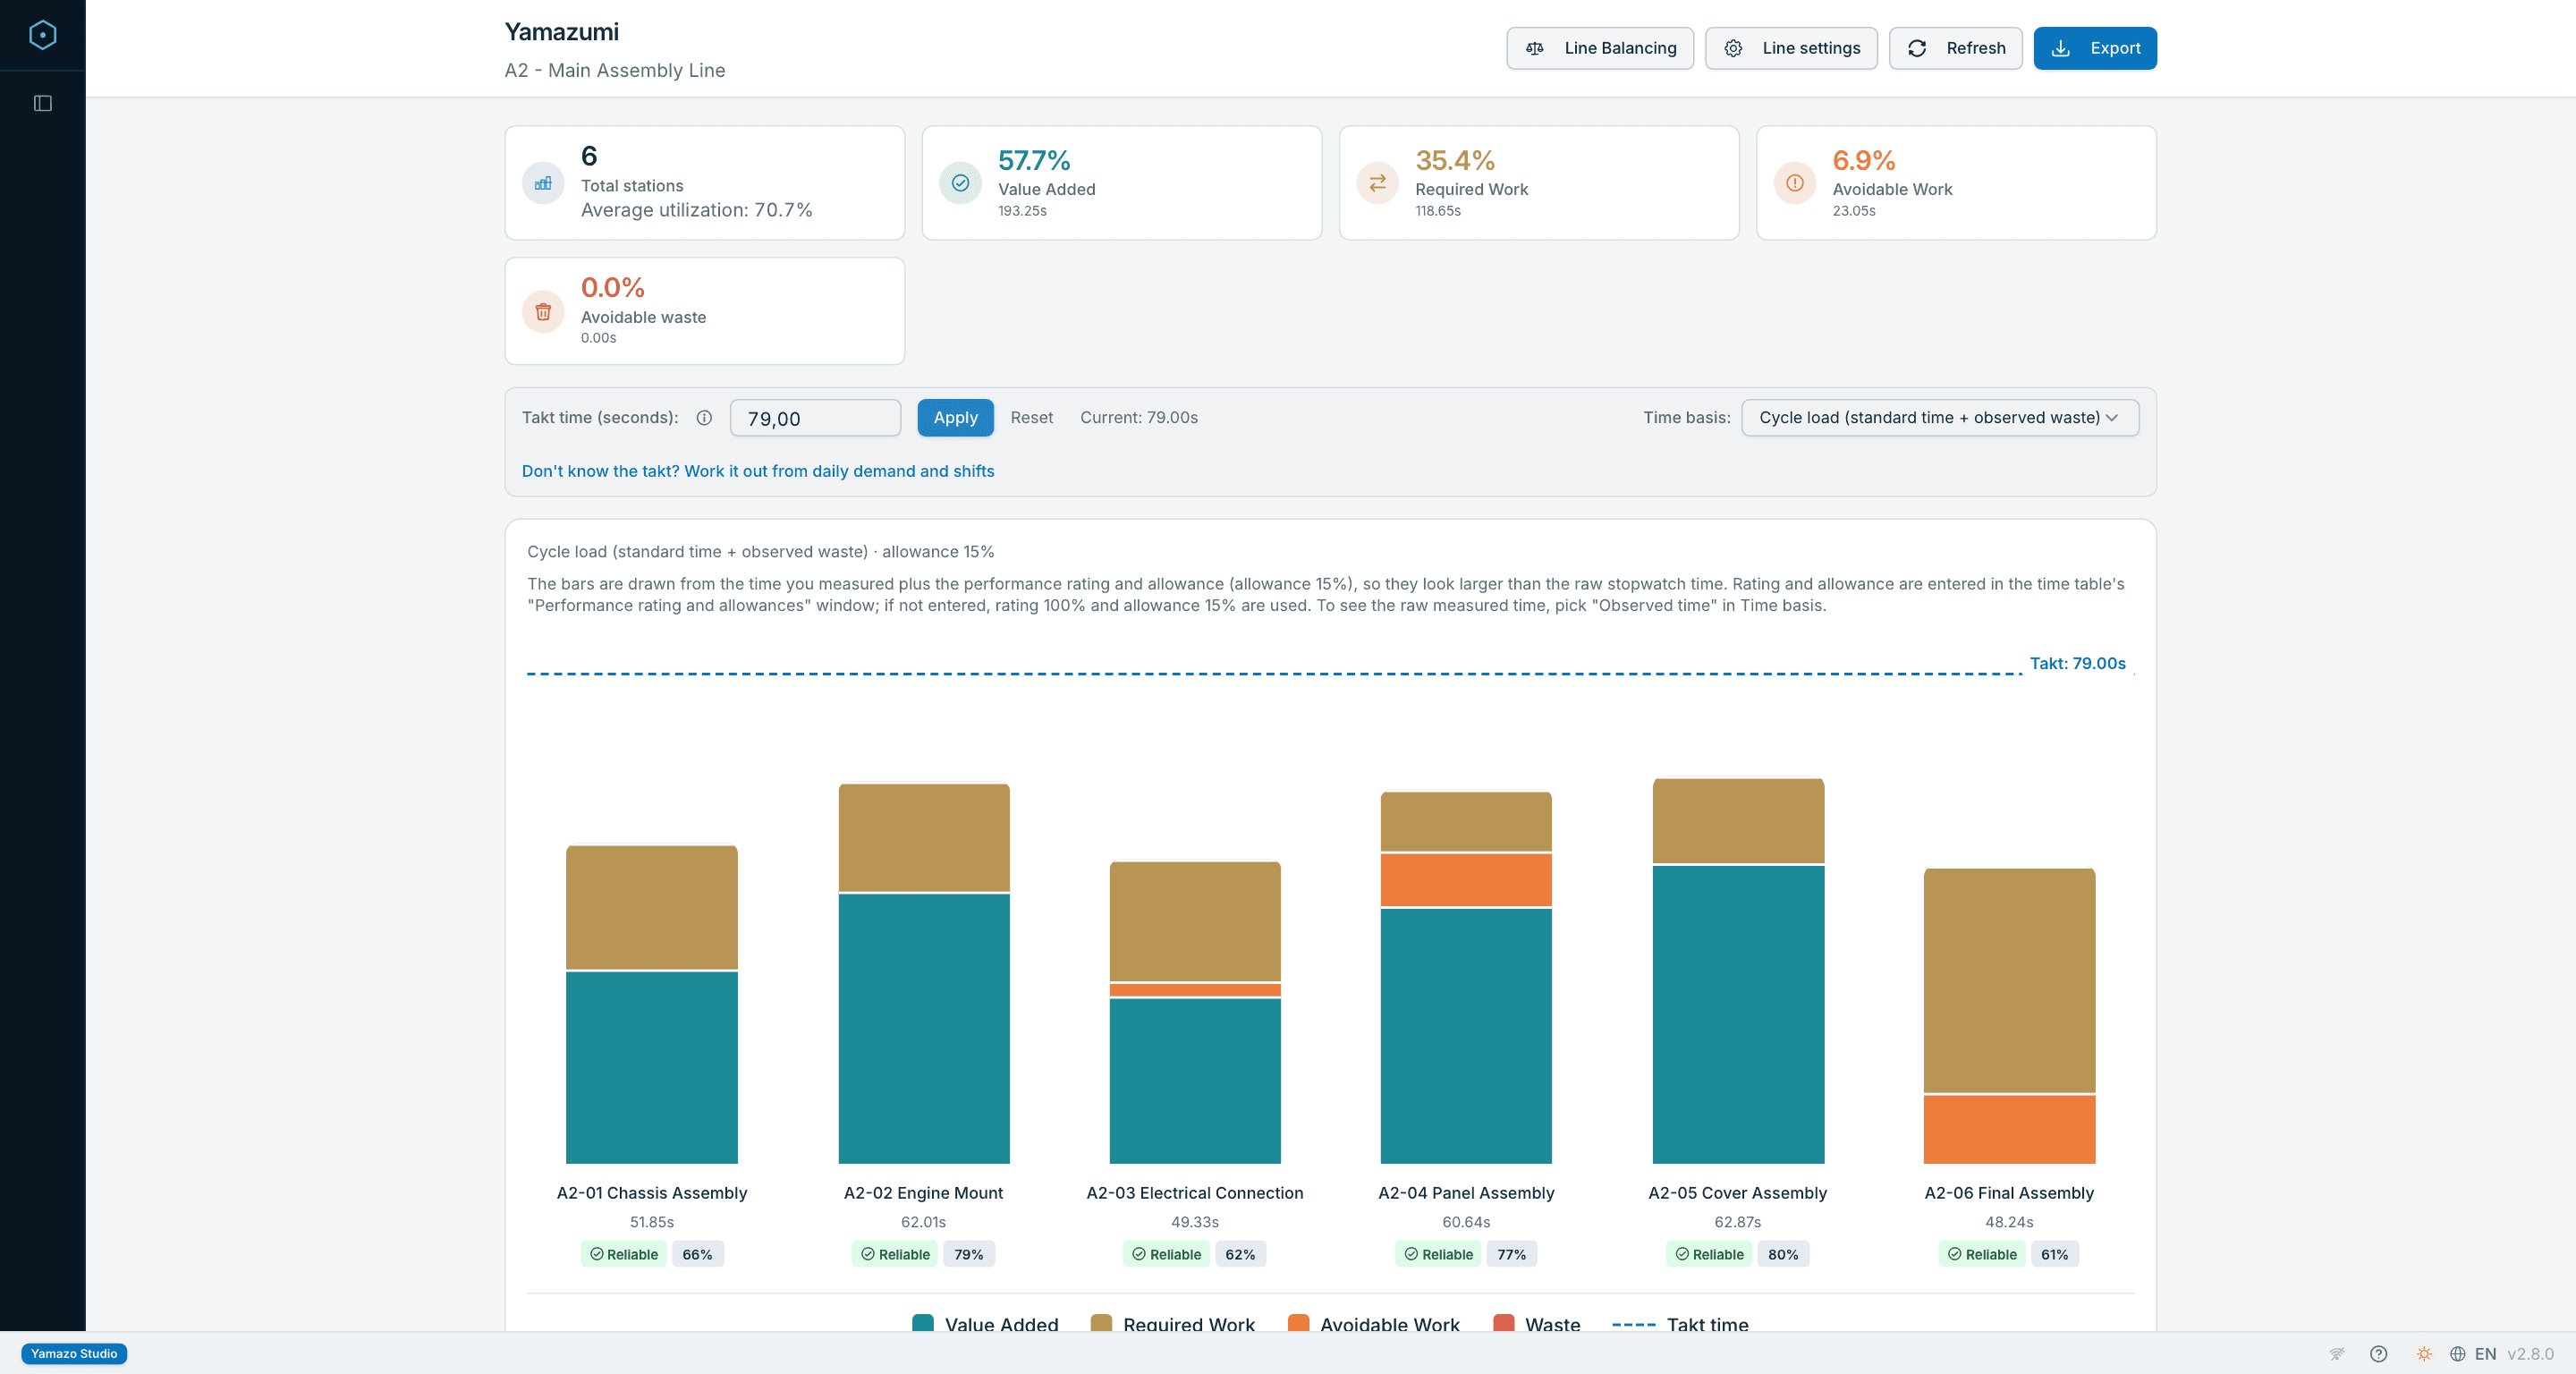
Workload charts grouped by station, operator or process. Value-added work, waste and waiting are split out; avoidable waste is shown apart from structural waiting, with a takt comparison and utilisation metrics alongside. You see the station running up against takt, and where the waste piles up, at a glance.
Standardized Work Combination Table
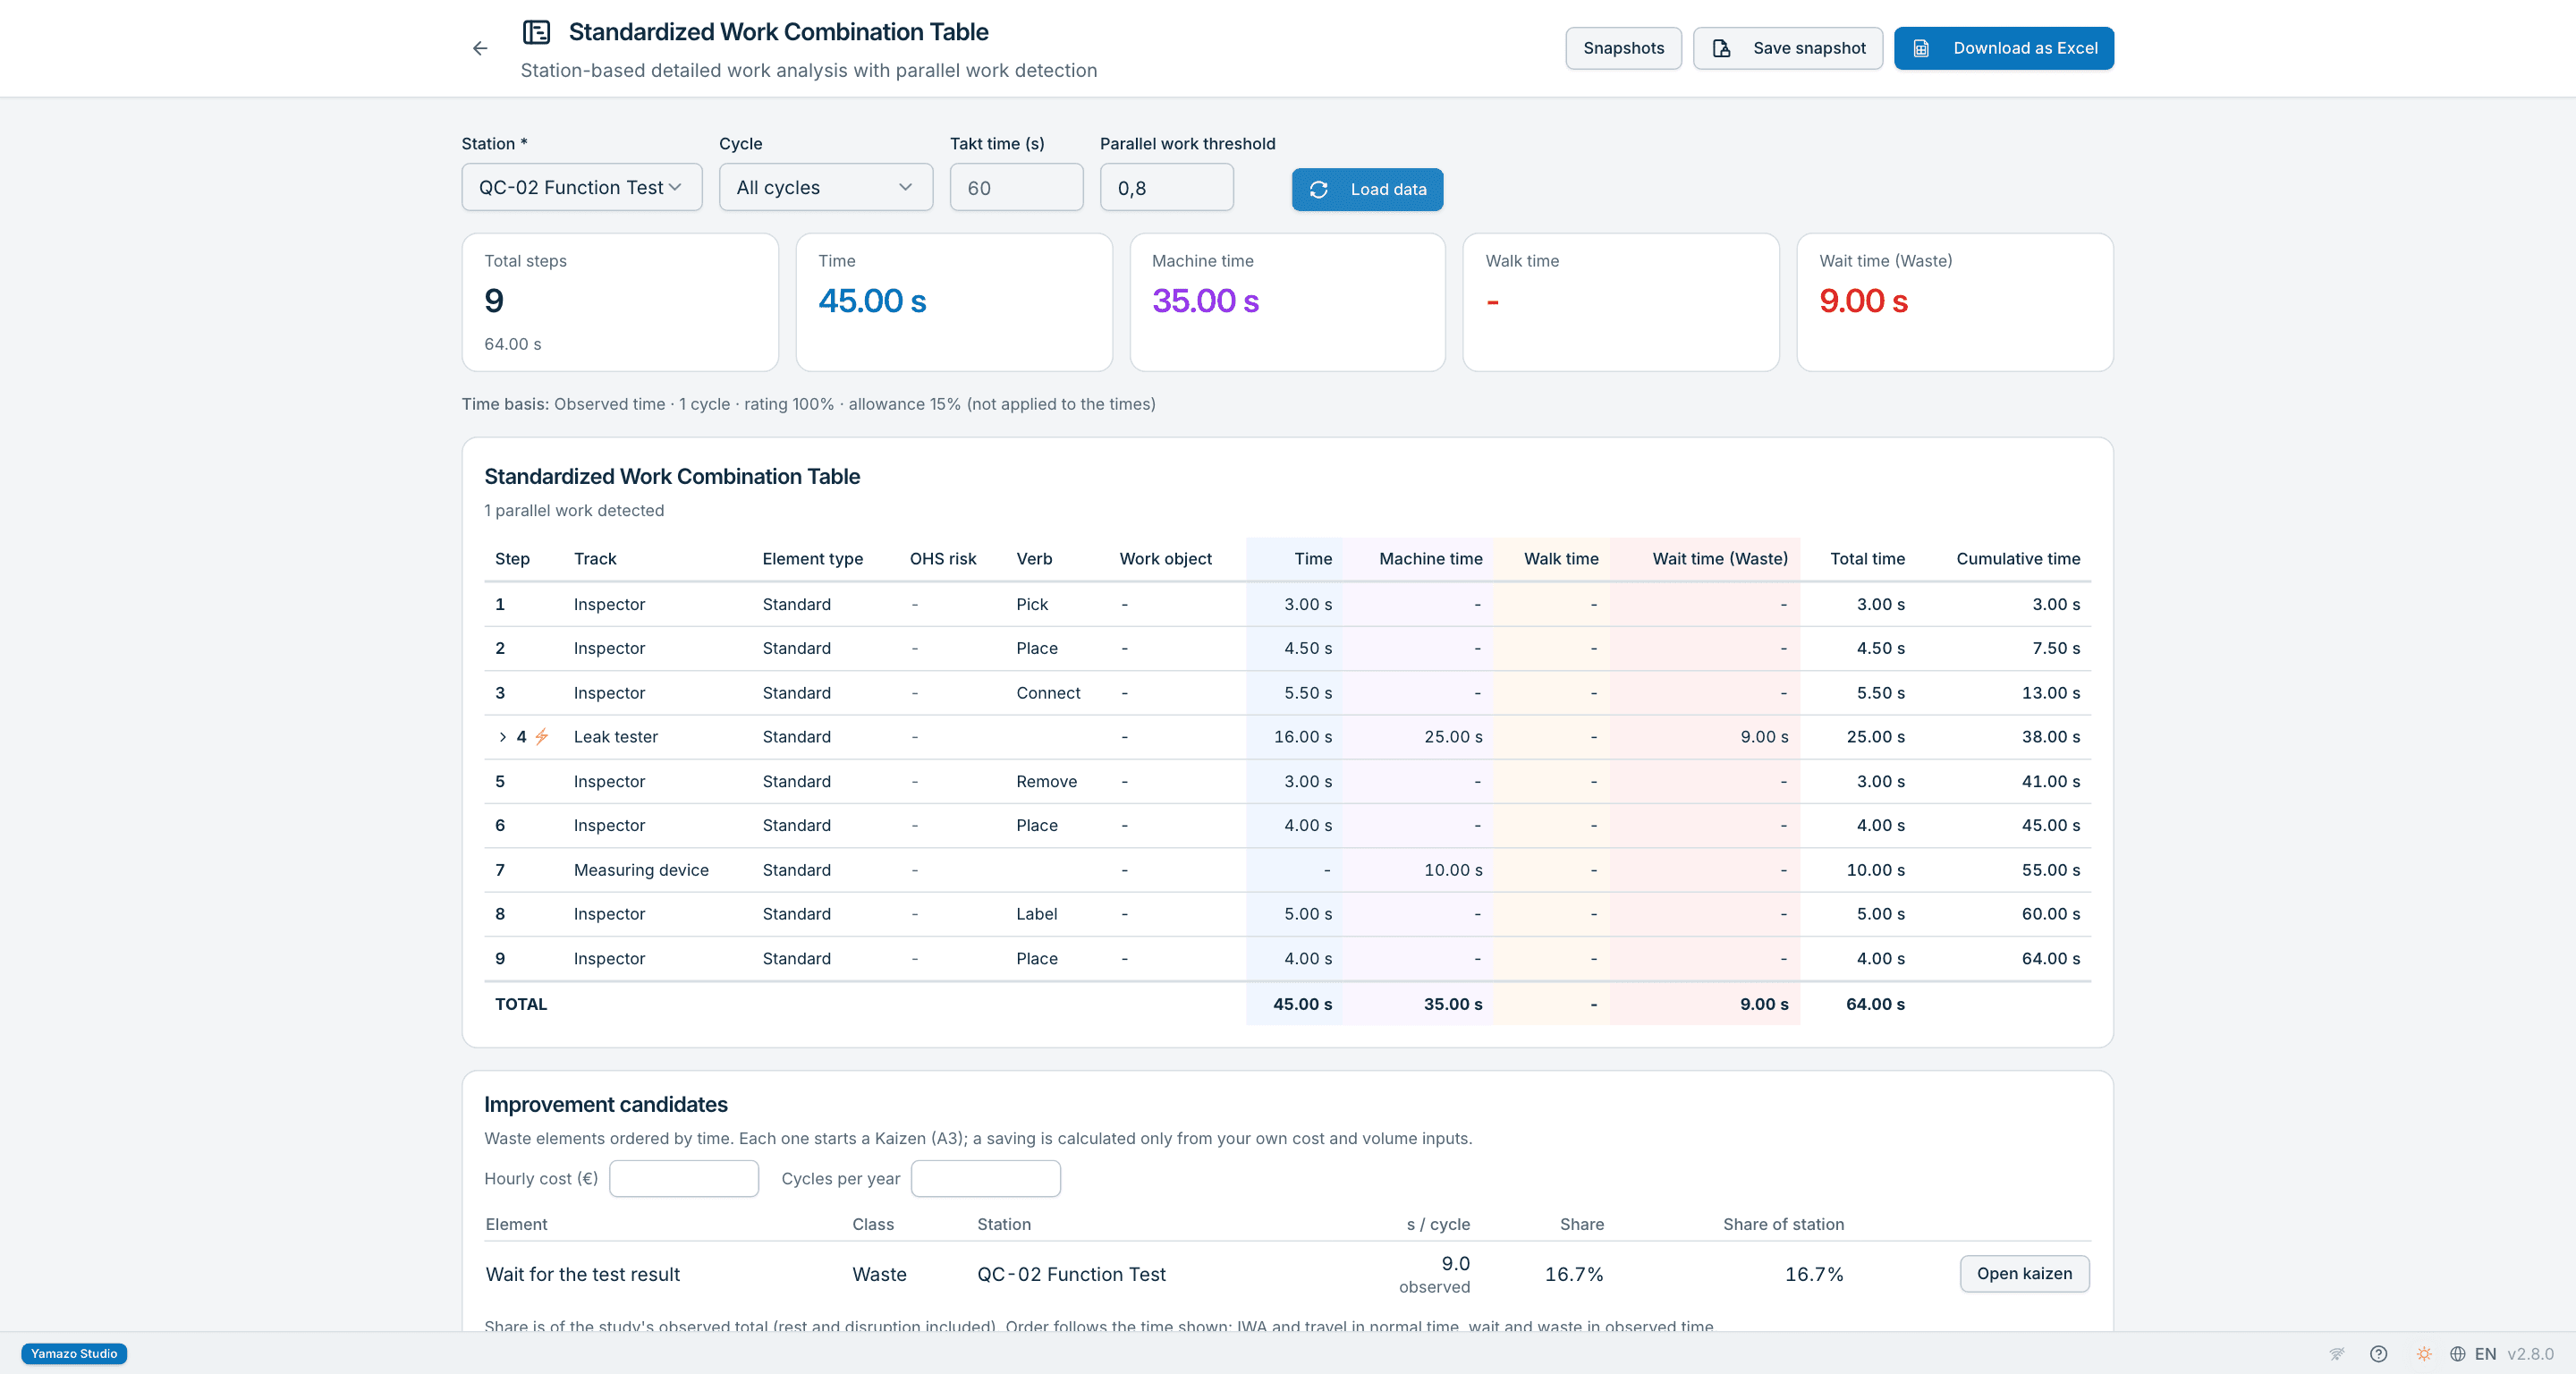
Station-based analysis with parallel-work detection: manual, machine, walking and waiting time are tracked separately; Gantt timeline view with cumulative tracking. Walking and waiting show up apart from manual work.
Line Balancing Simulation
Scenario comparison for operator allocation: build and compare several balancing scenarios, manage task priorities and dependencies, and follow the precedence relations in an interactive graph. You see what moving a task does to the line before anything changes on the floor.
Workforce Planning
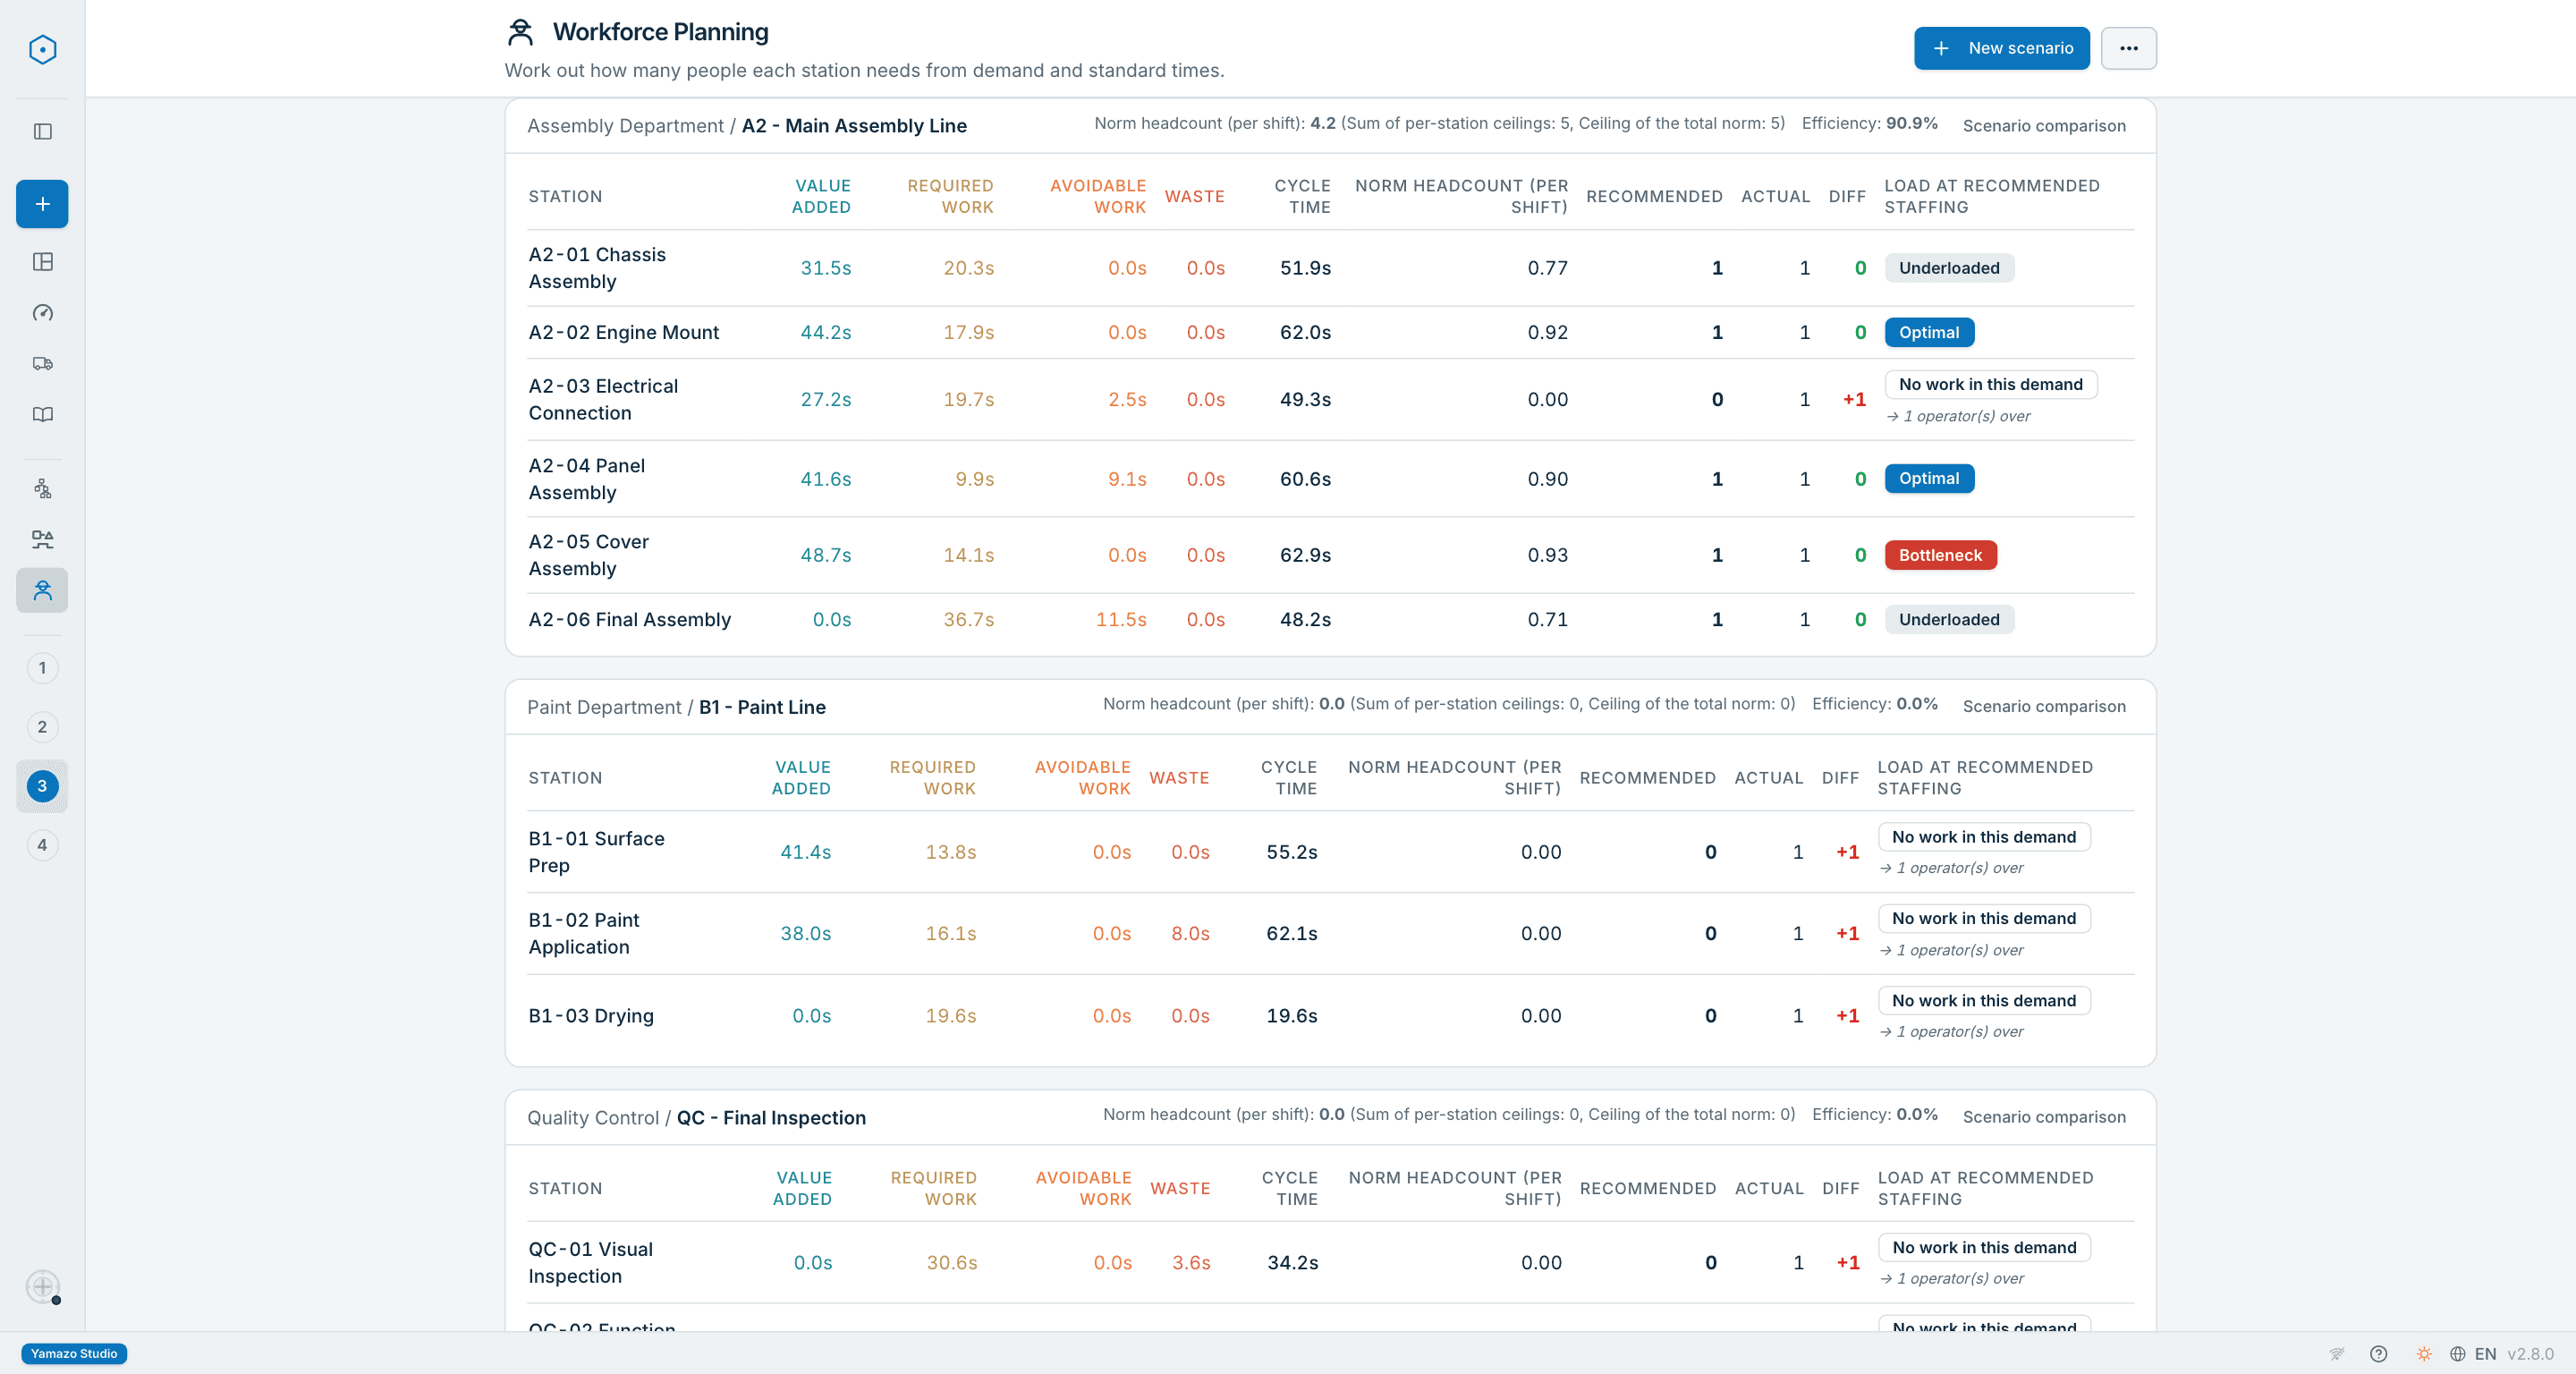
Scenario-based headcount optimisation: calculate norm staffing from real SOT data, compare the current and the improved allocation, and identify bottleneck stations in multi-shift operations. The staffing discussion rests on times you measured yourself.
VSM — Value Stream Mapping
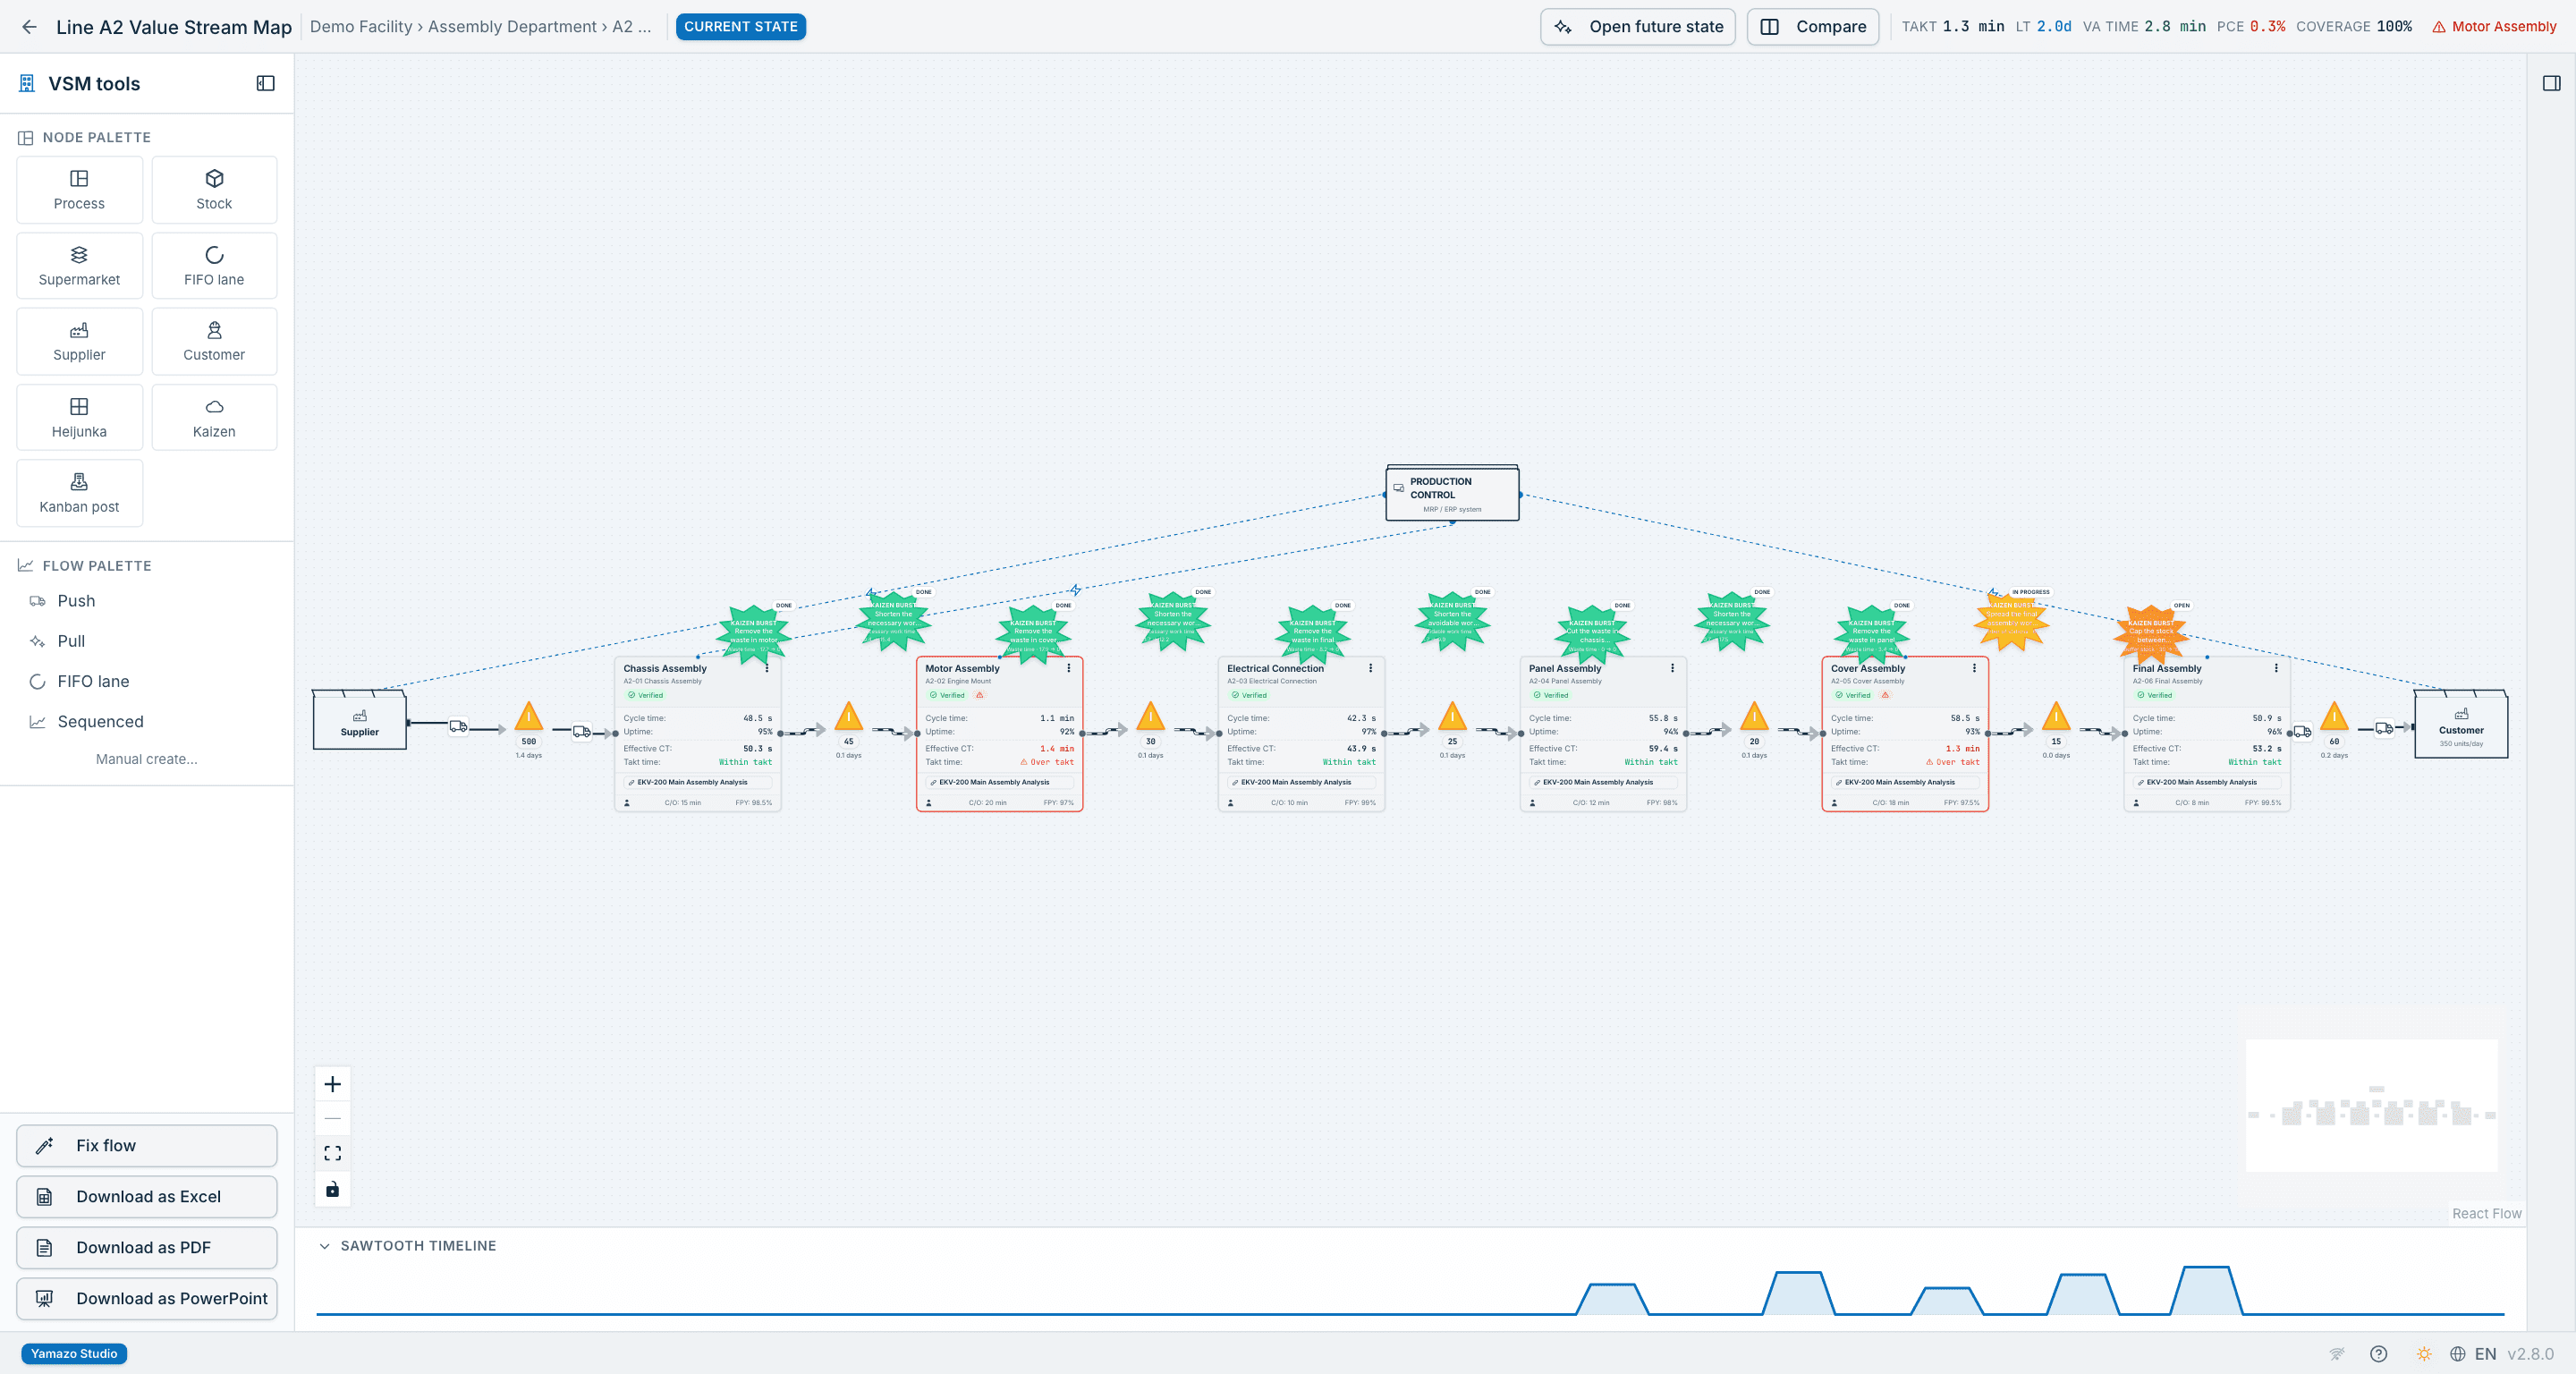
Supermarket, FIFO lane, kaizen burst, heijunka box, kanban board: the full set of lean mapping symbols. Multi-line product families and mixed-model takt are supported. You carry the map into a presentation or report as Excel, PowerPoint or PDF.
A3 Kaizen Board
Standard 7 sections: Background, Current State, Target State, Root Cause Analysis, Countermeasures, Implementation Plan, Follow-up. A draft → reviewed → approved chain with a double-approval check. You turn a problem into a kaizen with one click, and the approval chain is visible on the board.
Cycle Report
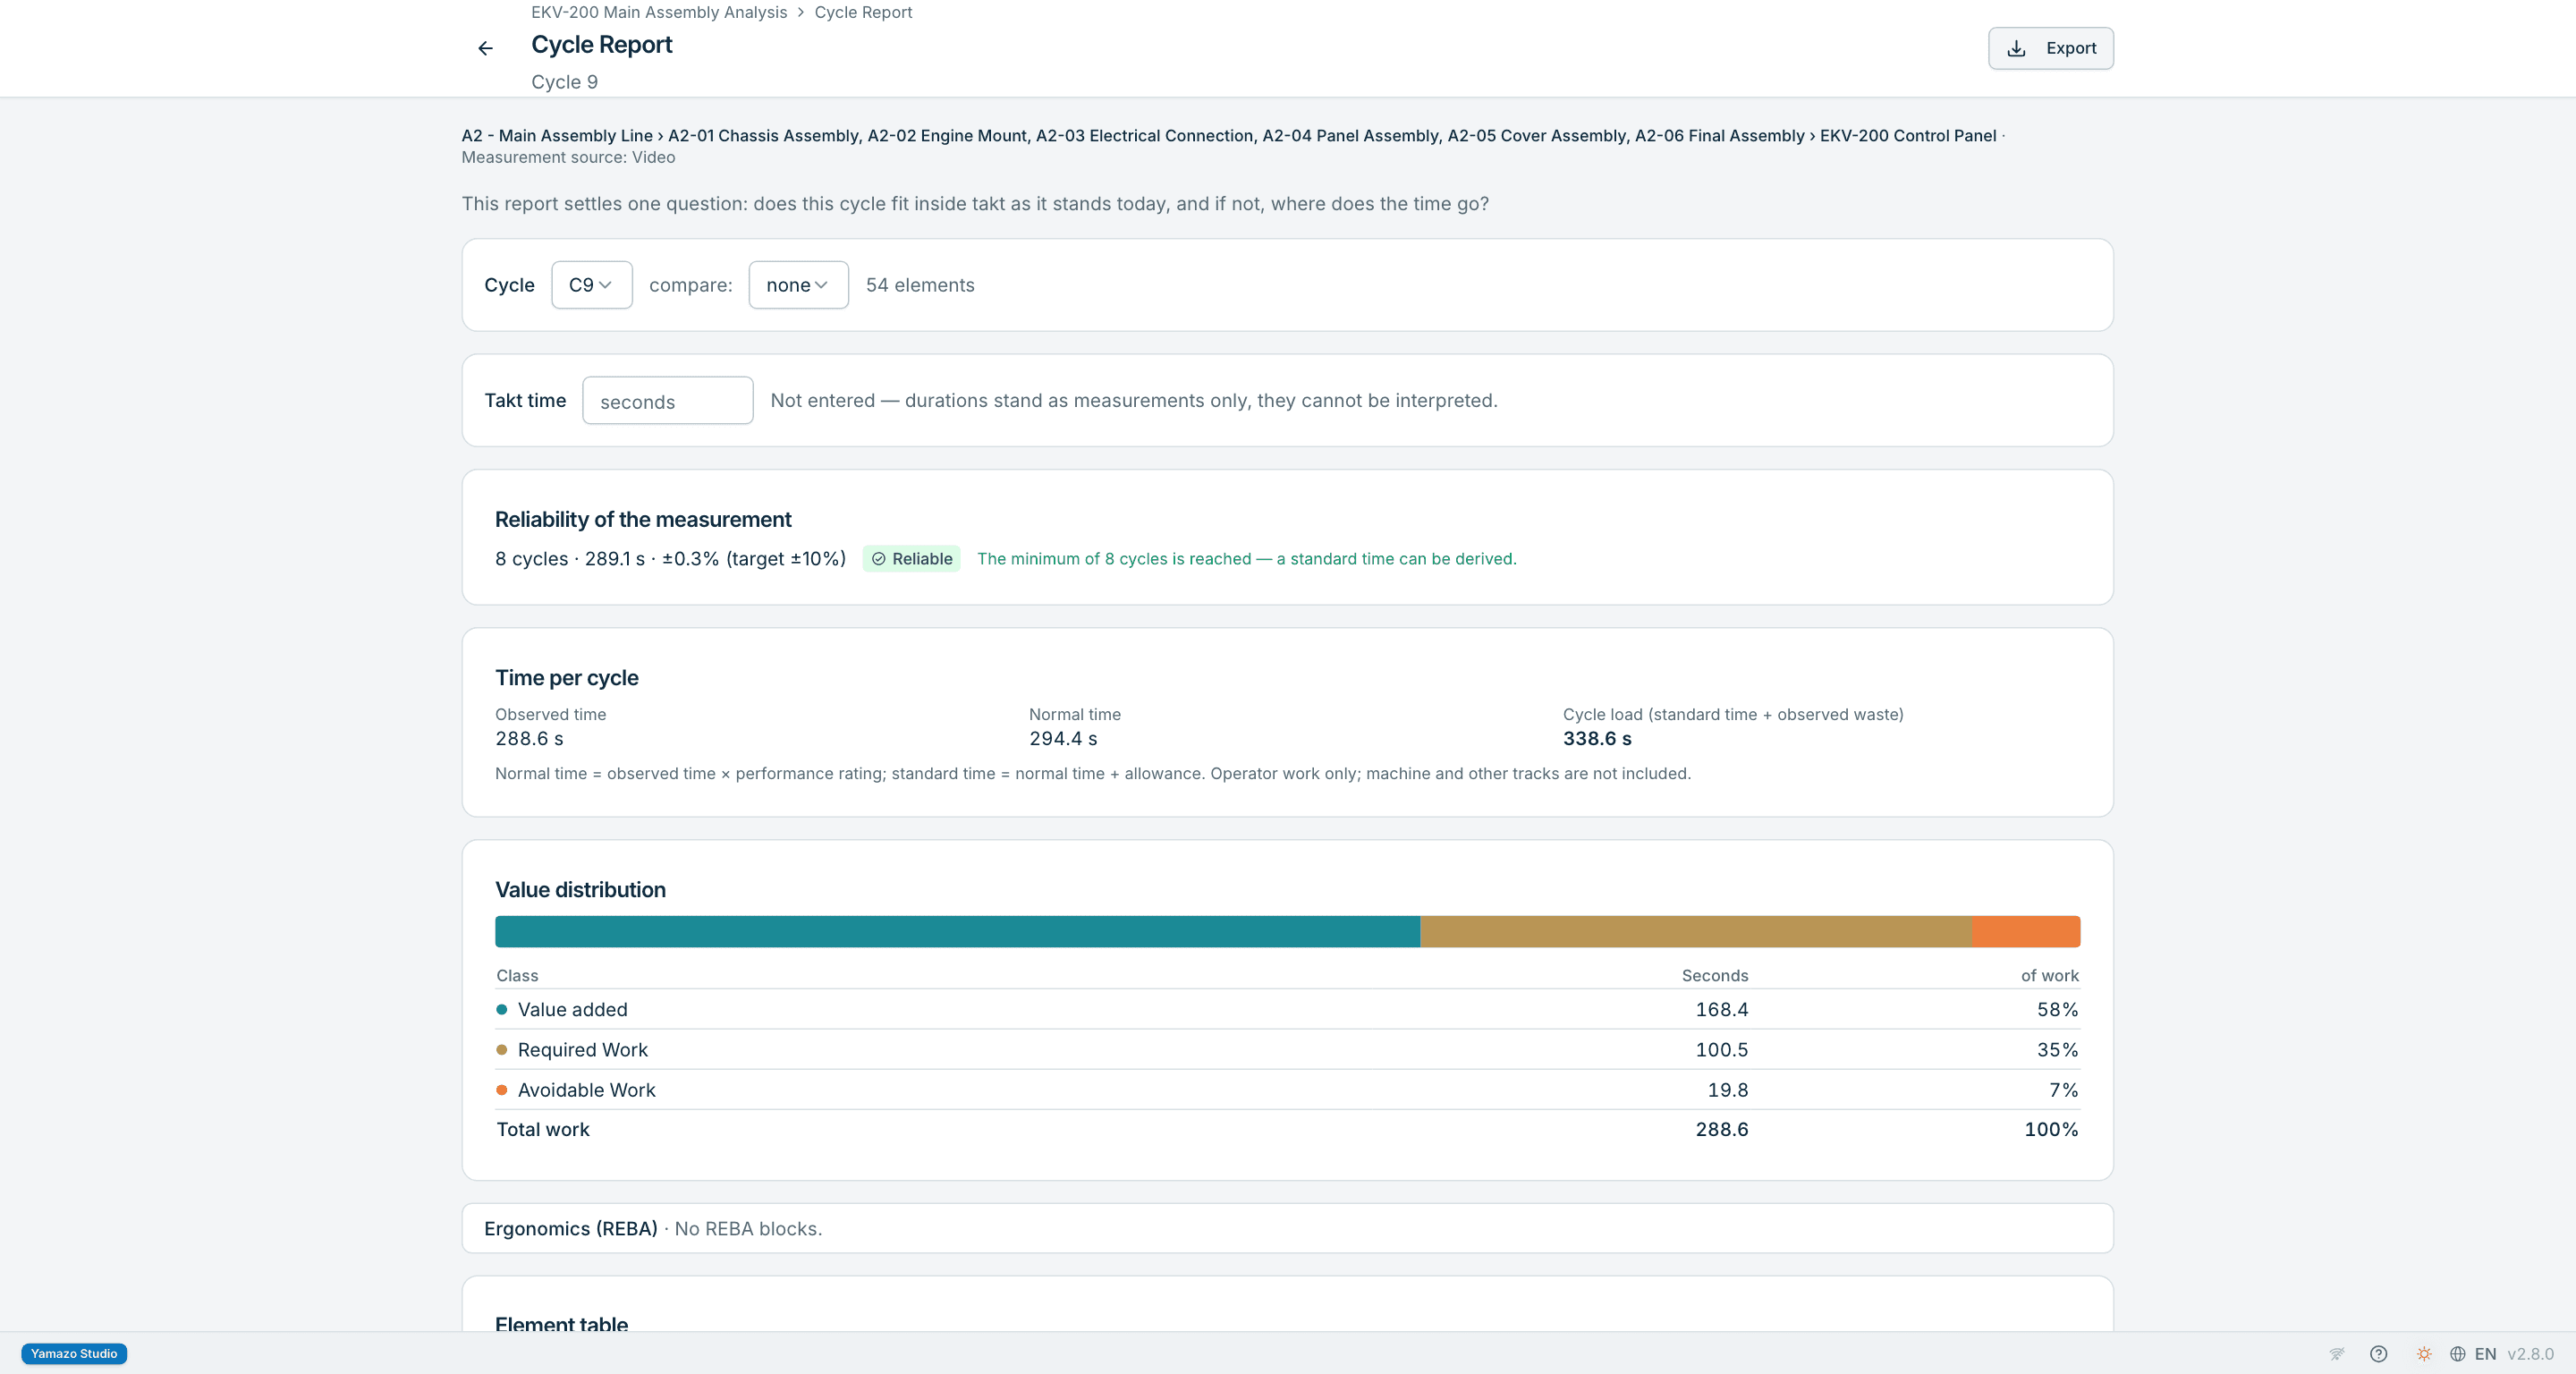
Pick a cycle, compare two cycles chronologically, export the report to Excel. The value split (on the demo line 62.0% value added · 31.3% required work · 6.7% waste) and the element table are read within the scope of the same cycle. The page does not contradict itself.
Release Workflow for Allowance Tables
An allowance type starts as a draft, goes into use with Release and out of use with Withdraw; the method, rate, scope and table version of a released type are locked. With Airlock, a release is a proposal and takes effect when a second person approves it at the Airlock desk. A released allowance rate does not change silently, and a withdrawn type leaves the rows of the studies that picked it untouched.
Sufficiency per Element
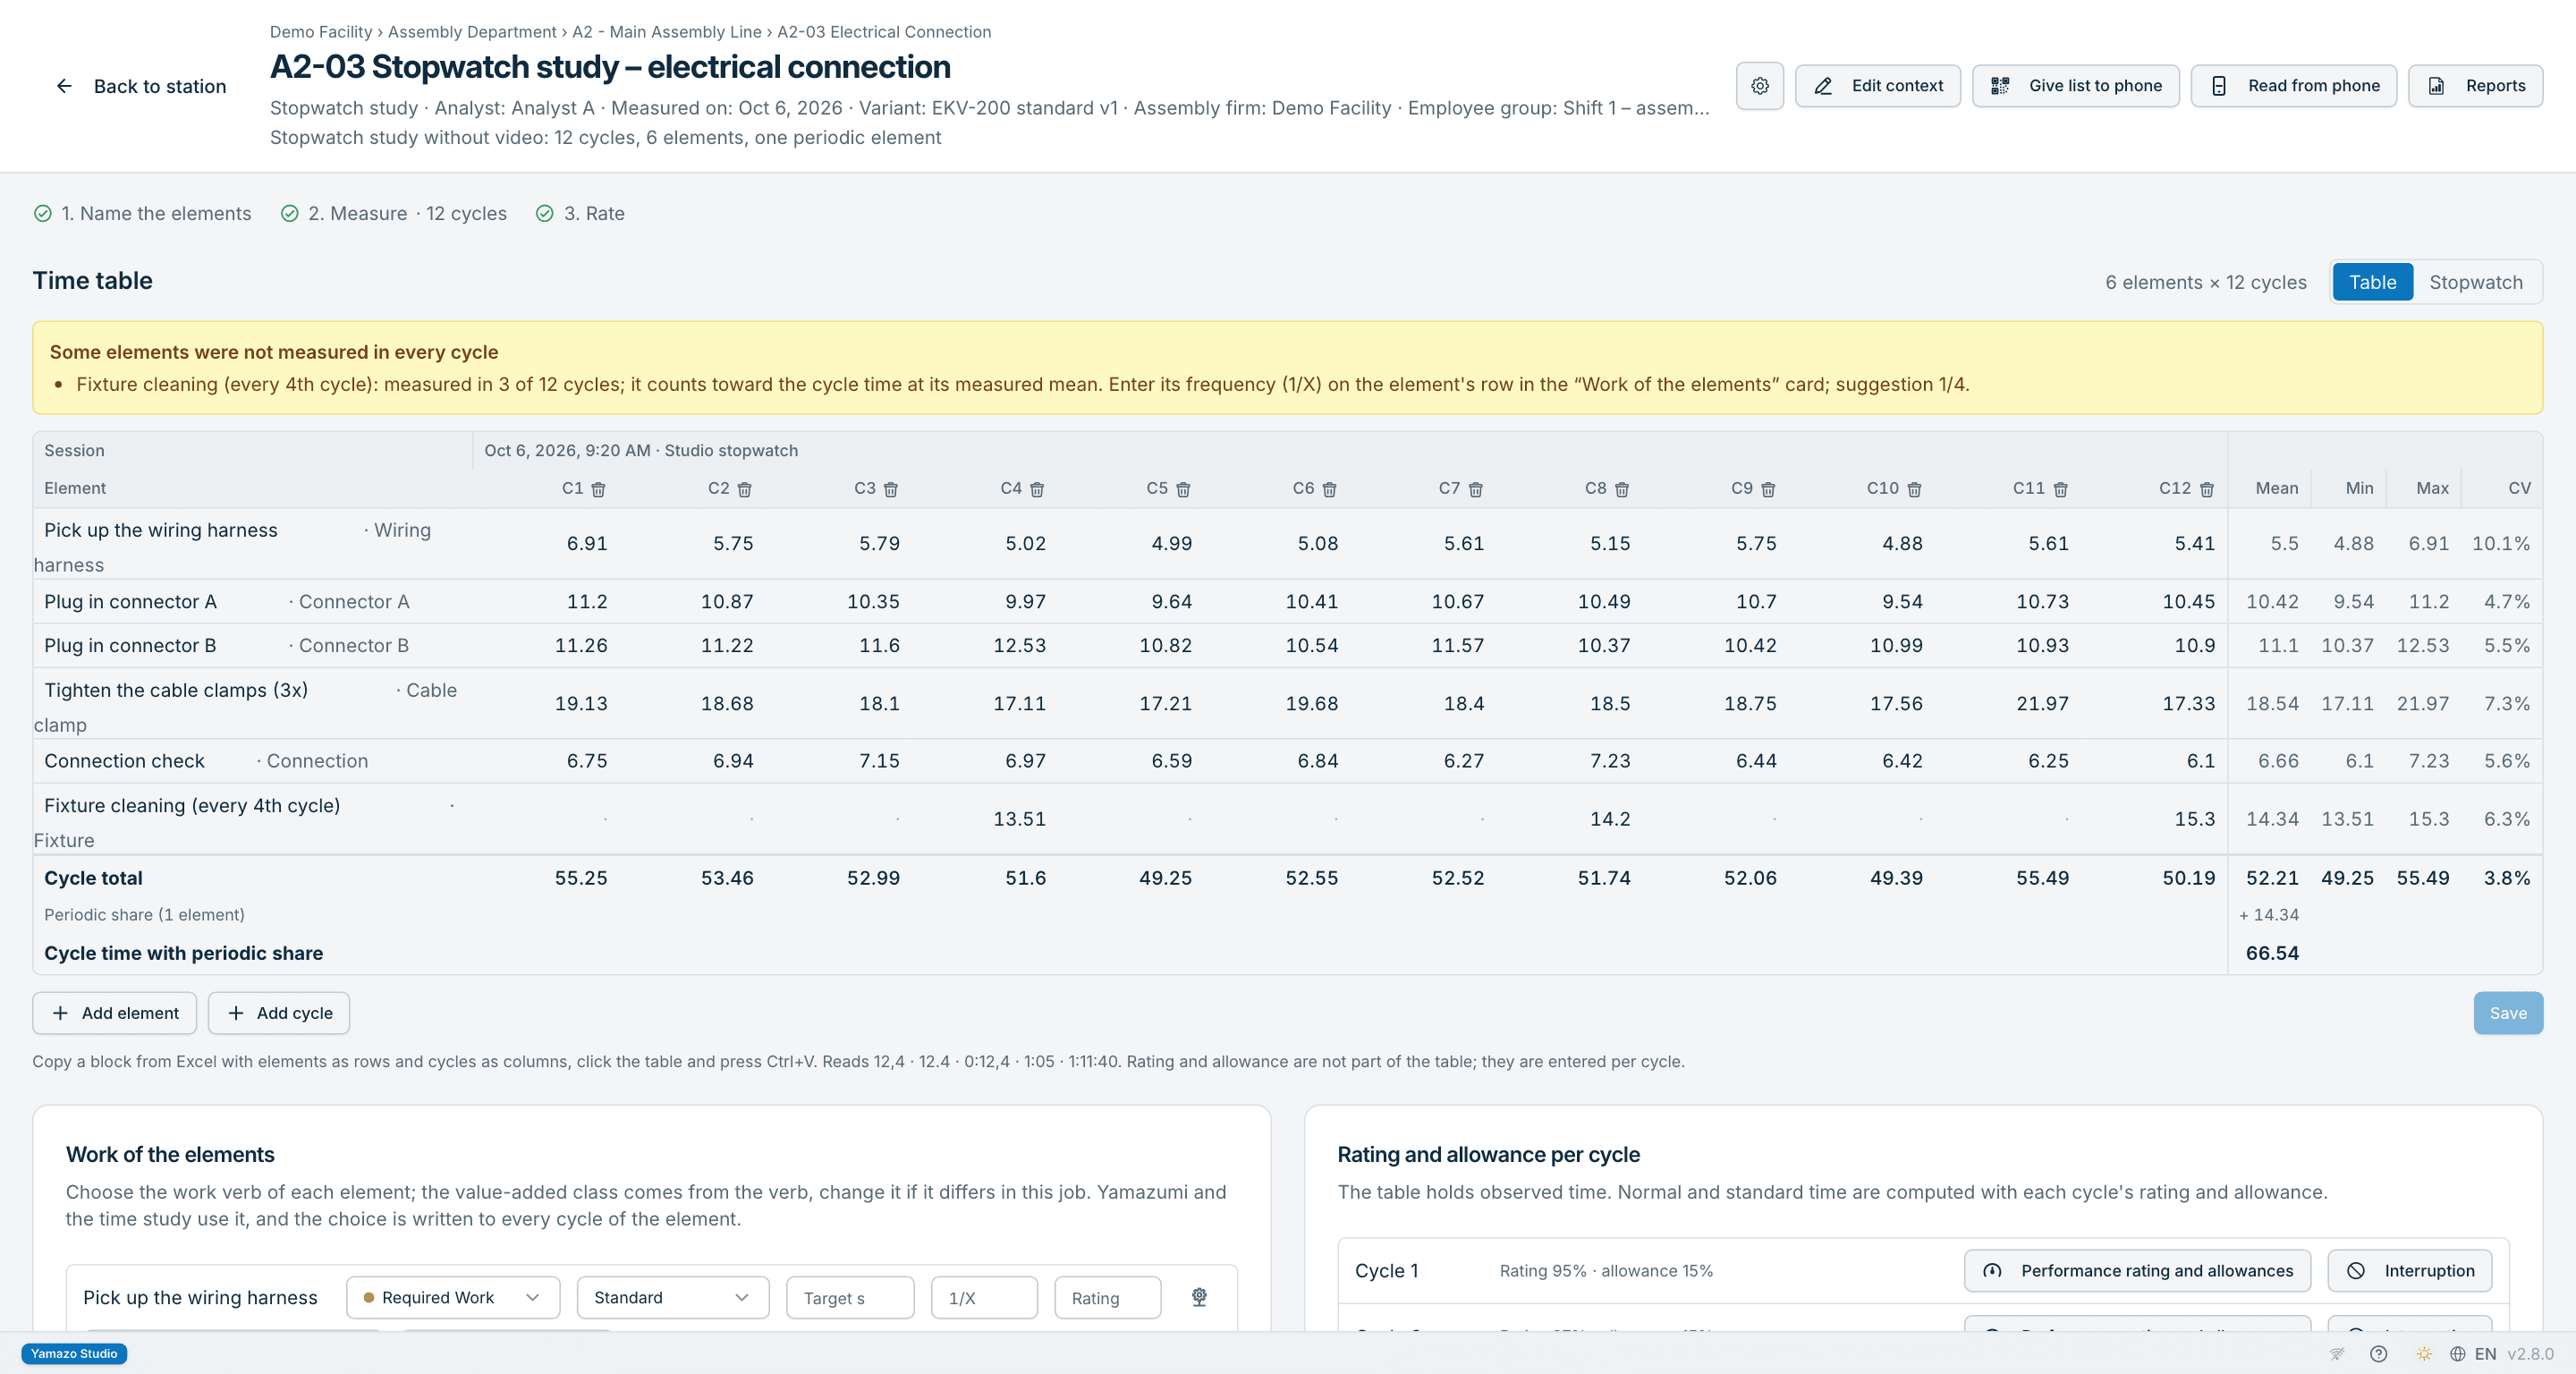
In the stopwatch statistics each element is tested on its own readings: at least 8 readings, coefficient of variation at most 25%, and the target precision. The table shows how many more readings each element needs. You do not have to guess how many more times to measure which element.
Full module list
Frame-Accurate Video Analysis
Frame-by-frame video navigation and 25+ keyboard shortcuts; the start and end of every work step are marked exactly. MP4, MOV and WebM. You place the boundary of every work step with frame accuracy.
Multi-Video Analysis — Treat Multiple Videos as One
Analyse several videos as one combined timeline; virtual joining without using disk space. You analyse a folder of videos as if it were one continuous recording.
Video Annotation
Draw arrows, circles and text directly on video frames; export the marked screenshots for training material and reports. You show the team the critical point on the picture itself.
Performance Rating
Westinghouse rating for normal and standard time; the operator's pace and efficiency are rated for each cycle. The observed time is converted to normal and standard time according to performance. A single element can carry its own rating, and machine-controlled elements stay unrated.
Review Surface
The segmentation the engine produces is split, merged and reclassified by hand. The engine suggests, you decide: no automatic output becomes a standard without your approval.
Mixed-Model Lines
Balance and study lines that run more than one product; each product enters with its own demand, and a reference product sets the line's takt. You model mixed-model lines the way they actually run.
Skill Matrix
Map operator skills to stations and standard work; see coverage gaps and plan training. A station with no qualified person becomes visible.
Kanban Calculator
Calculates the number of kanban cards from daily demand, lead time, a safety factor and container size; a practical tool for pull systems. You set the number of cards by calculation, not by guesswork.
SMED Track — Setup Time Analysis
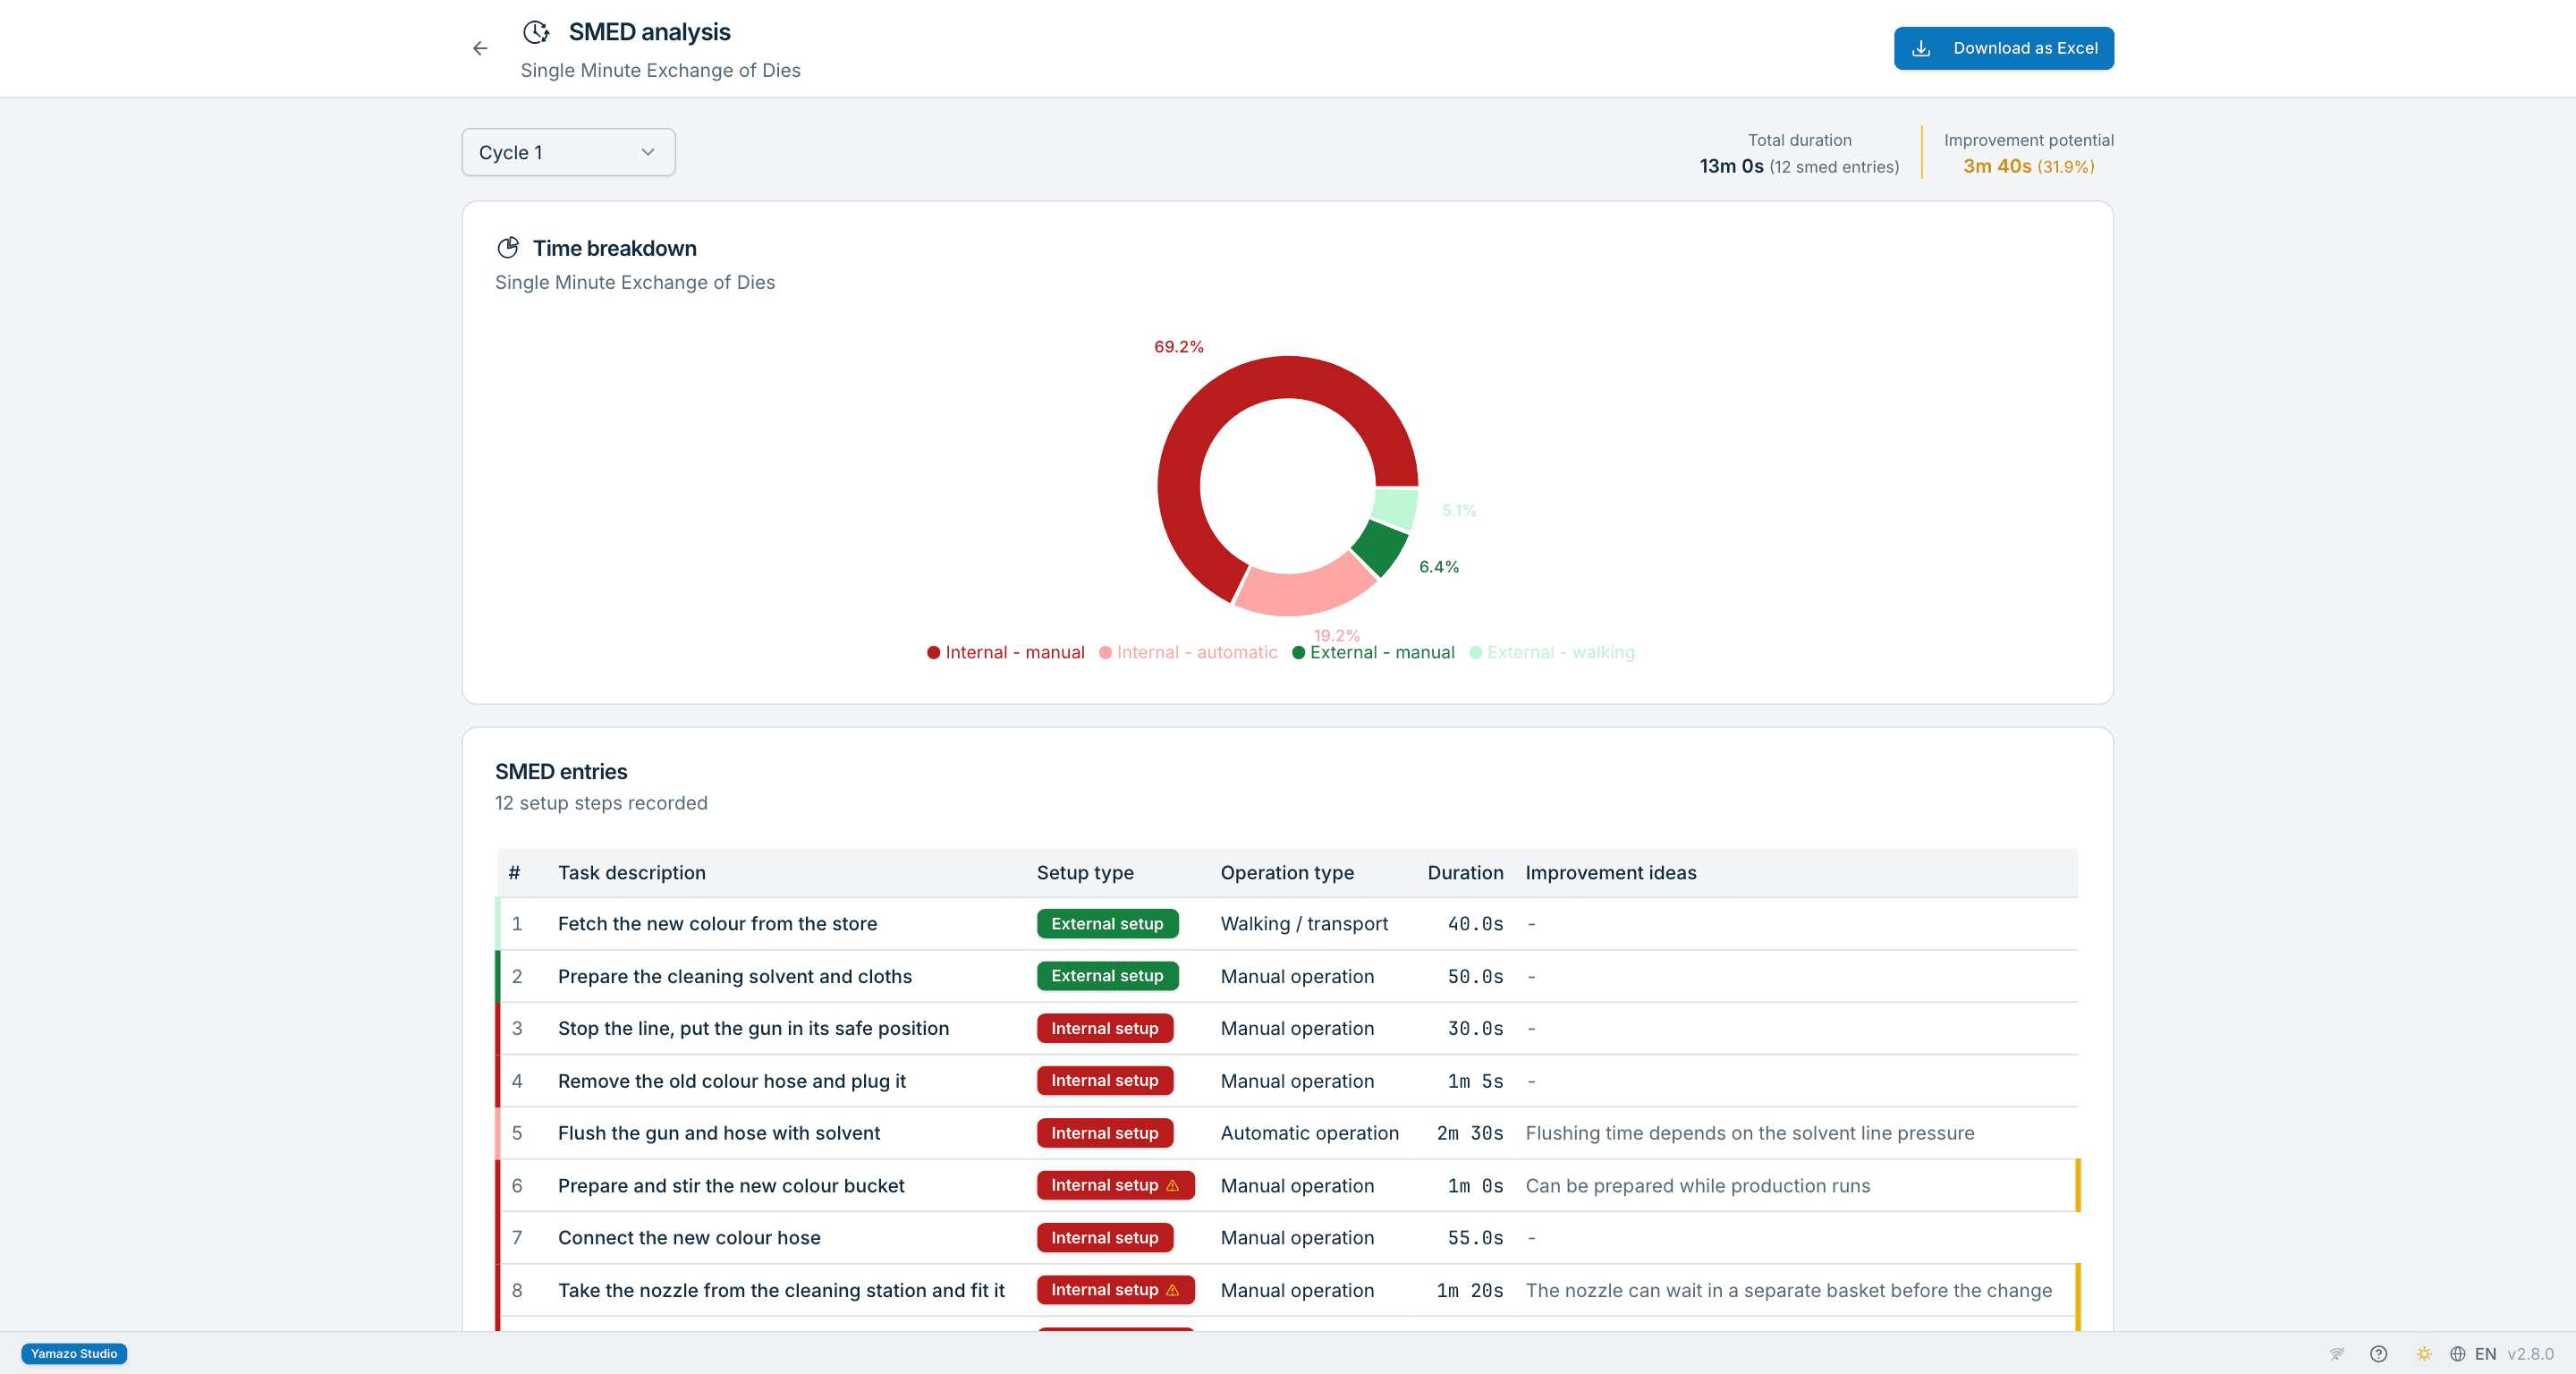
A dedicated track for SMED: separate setup operations into internal (machine stopped) and external (machine running) and follow the operation types (manual work, automatic cycle, walking). You separate the work that can be done while the machine runs from the stopped time.
Motion Memory
Search past work cycles by verb, line and product; find similar motions across studies and copy the best known kaizen into a new project. Instead of searching for an improvement from scratch, you copy the one already known.
Work Templates
Reusable work element templates classed as value-added (VA), avoidable work (IWA) or required work (IWR). Ready-made industry templates (assembly, inspection, movement) are adapted to your own plant. You do not redefine the same work in every study.
Work Instructions
Training material from video segments: export as a PDF document with screenshots. The training document comes out of the study; it is not written from scratch.
WERA — Ergonomic Risk Assessment
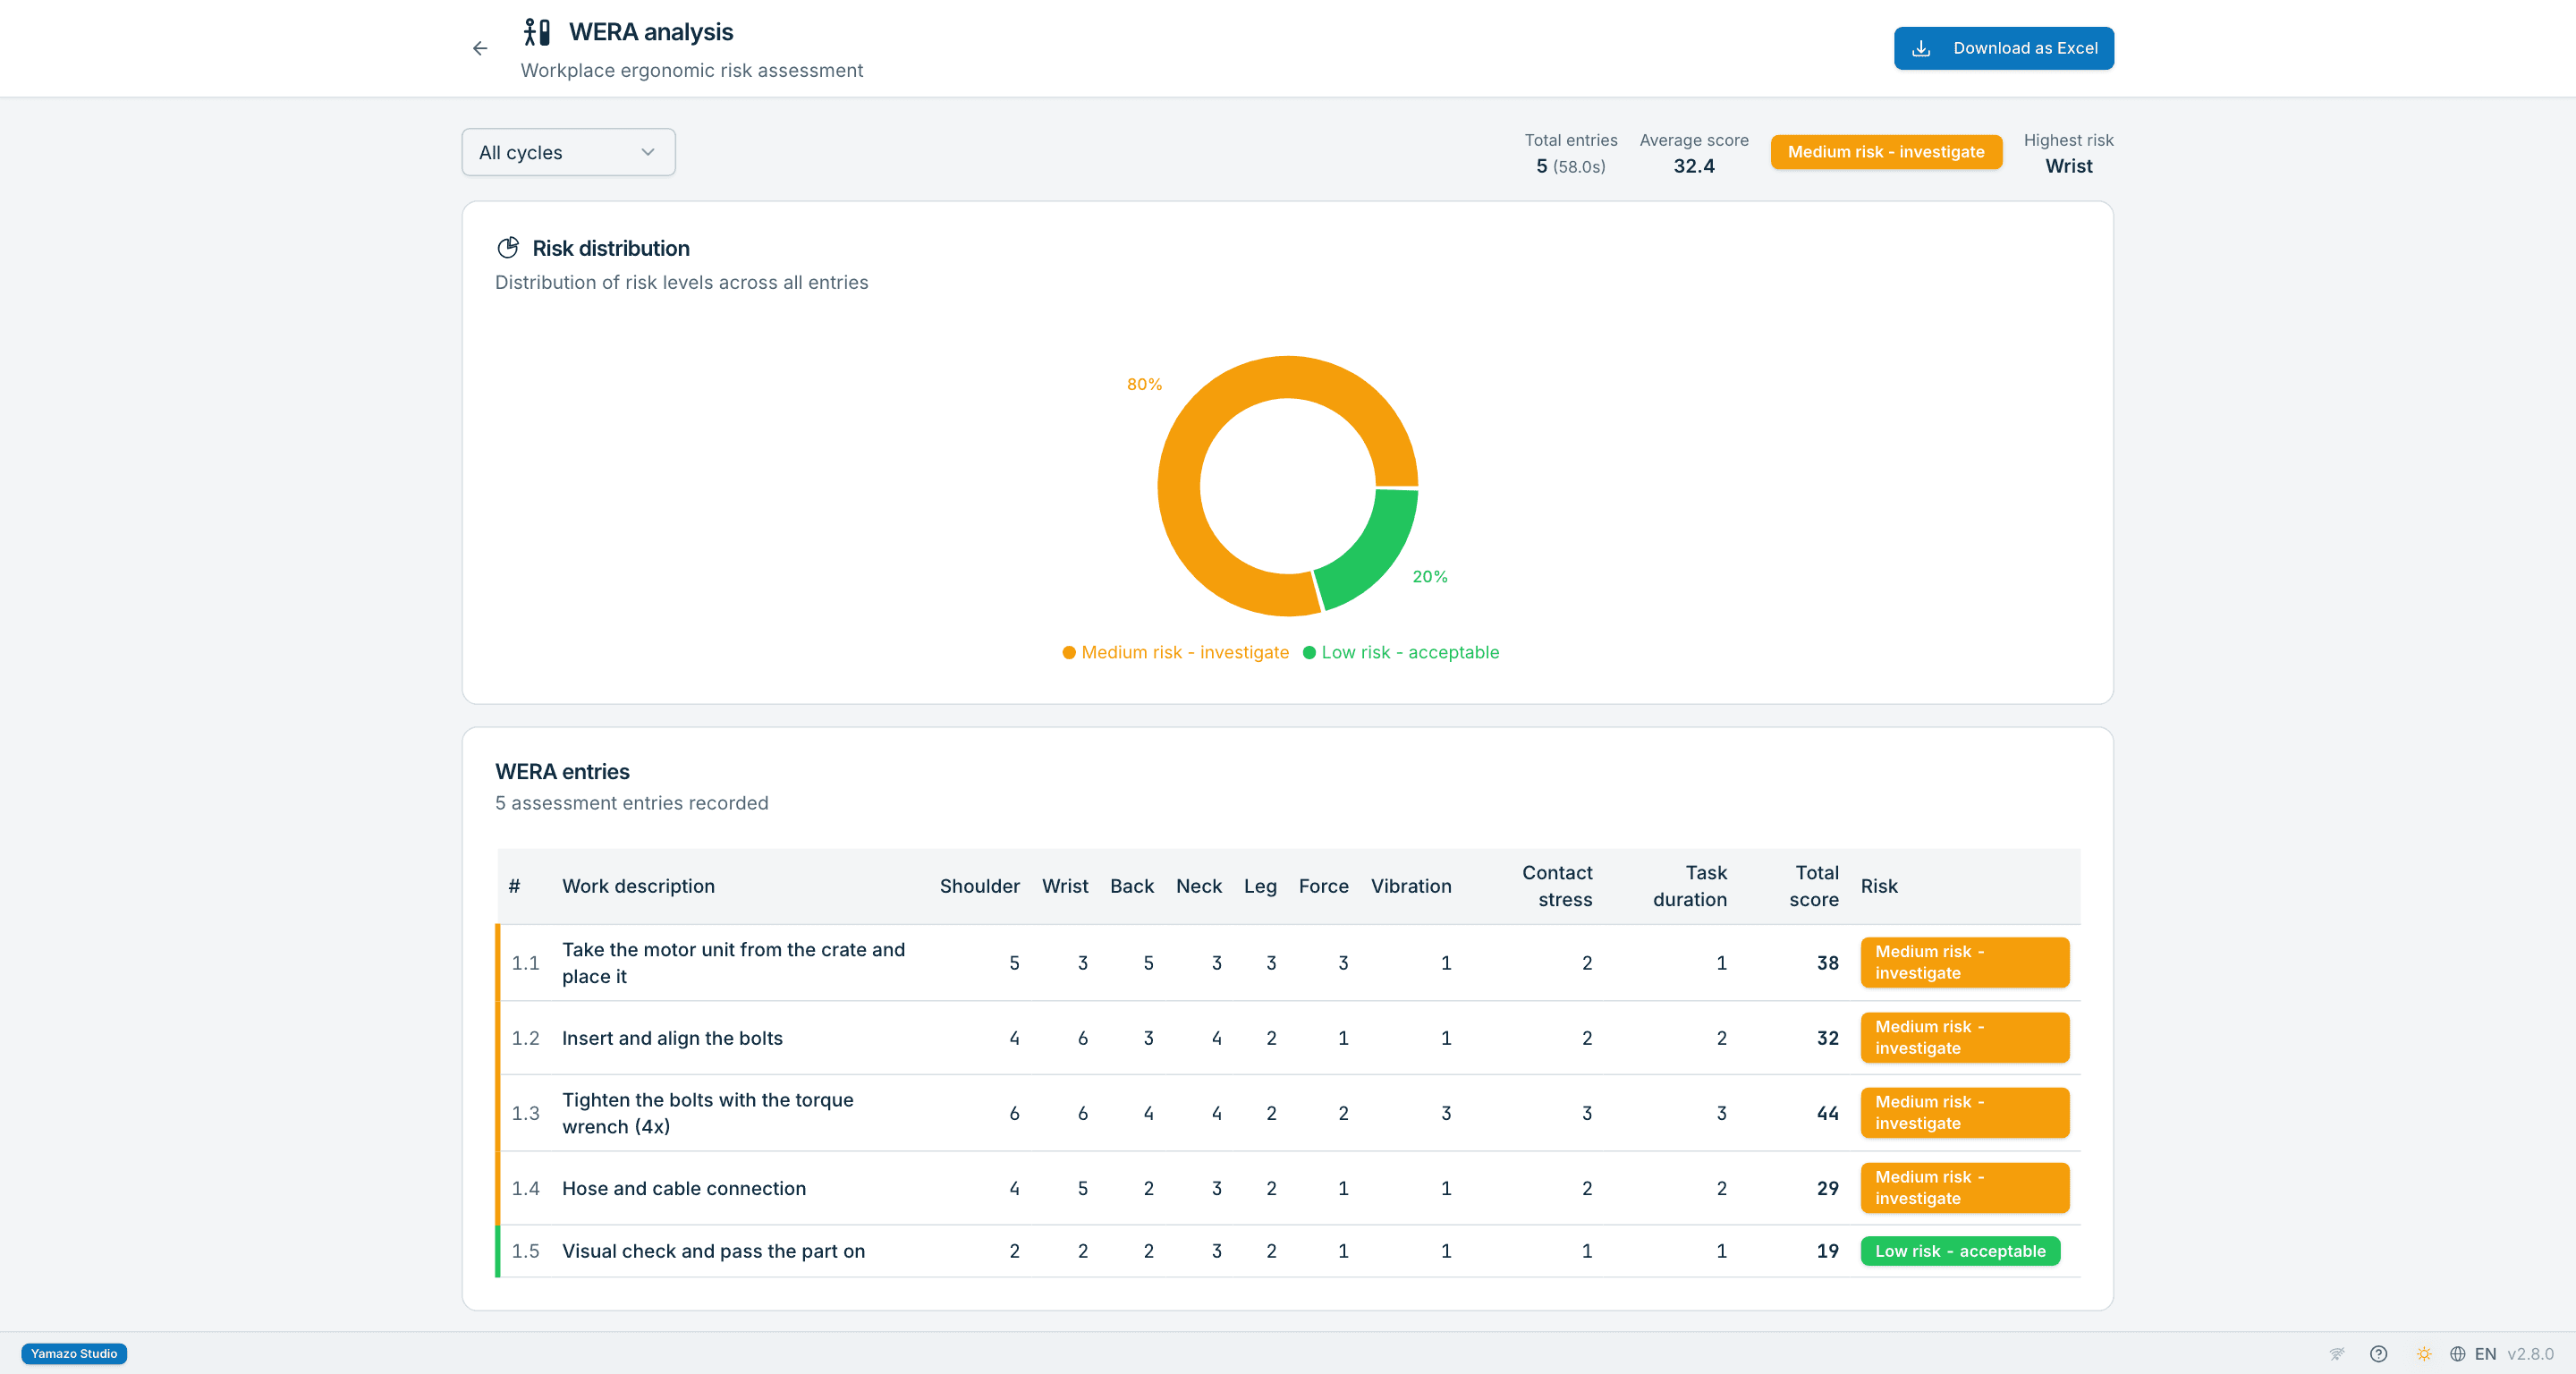
Posture and repetition for shoulder, wrist, back, neck and legs, with force, vibration, contact stress and task duration added, give a workplace ergonomic risk assessment; the result is colour-coded. You read the risky body region from its colour.
Temotoka — Work Evaluation Form
A 25-criterion method for evaluating operator motion: body posture, feet, hand and arm, tool use and eye movement are scored in 5 categories; the loss is calculated automatically from a base of 100 points. Motion loss becomes visible criterion by criterion and as a score.
Daily OpEx Cockpit
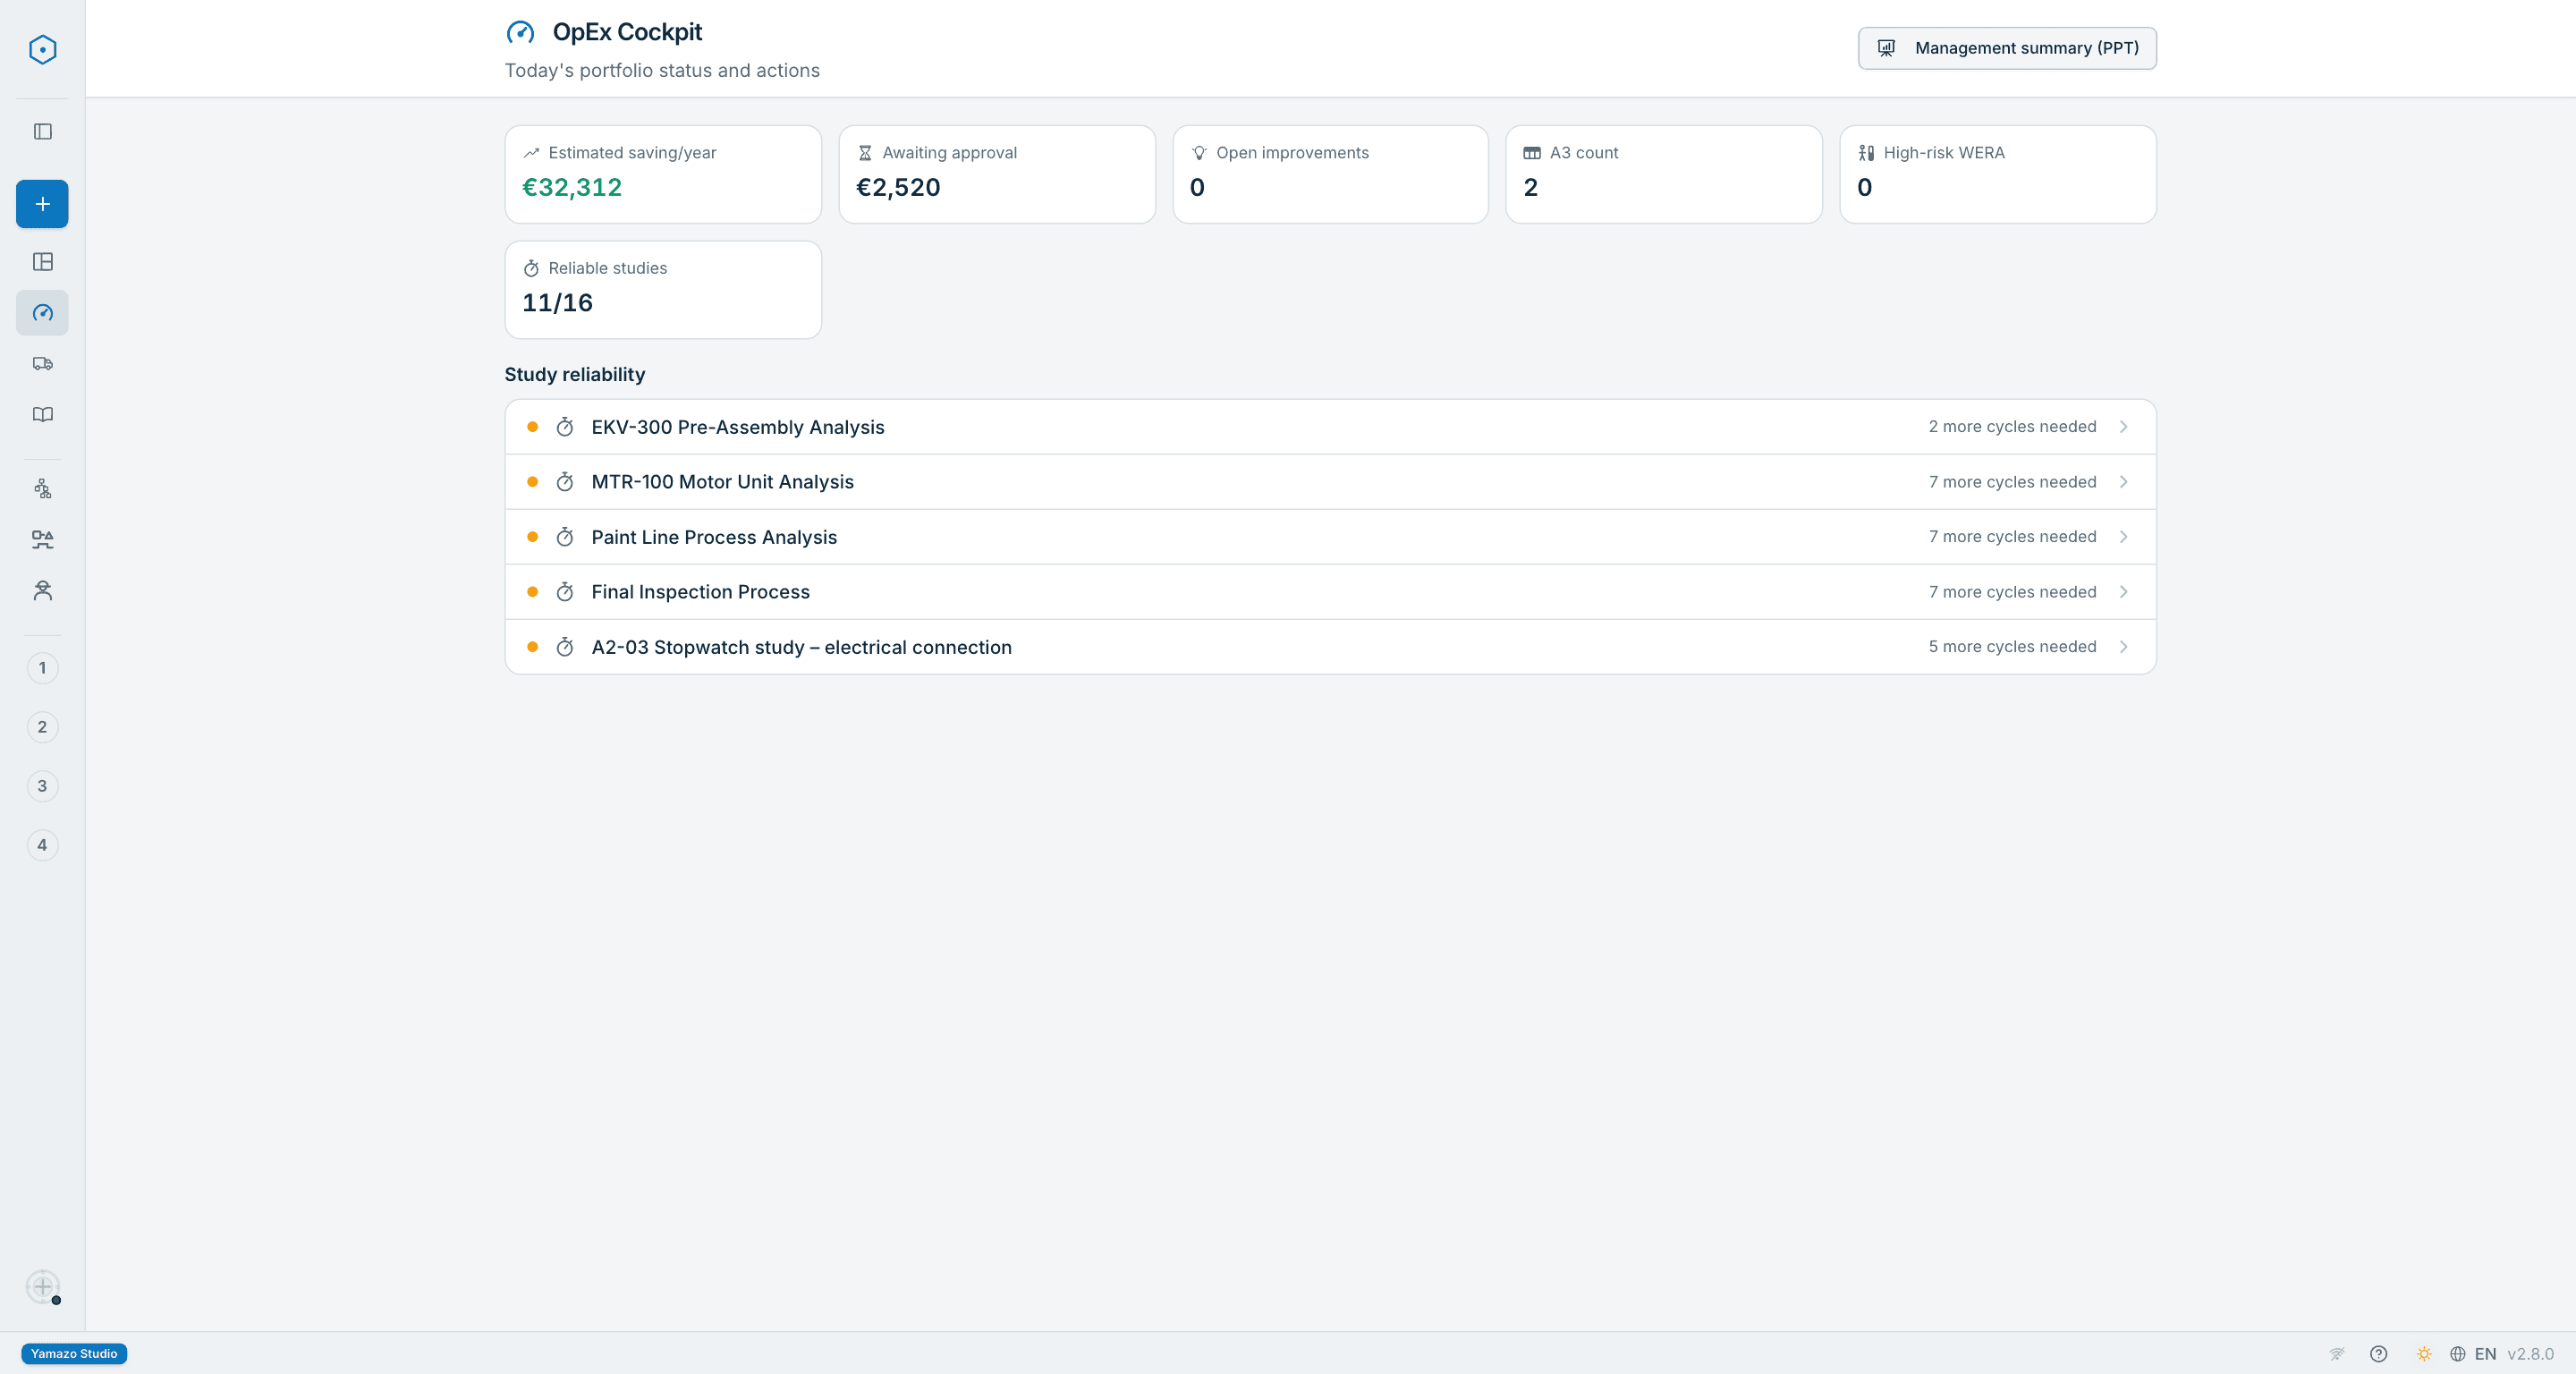
A daily command screen: key metrics, open improvements and the next action at a glance. The screen tells you what to start the day with.
Professional Reporting
PDF, Excel, CSV and JSON exports: SOT facts with pivot tables, the combination sheet with Gantt charts, the Yamazumi with visual distributions. You take the result to management in the same form you analysed it.
Audit Trail with Tamper Detection
Every operation that changes data is logged automatically with its time, action and result; entries are linked by a SHA-256 hash chain and the activity page verifies the chain. A record that was edited or deleted afterwards is noticed; verification reports tampering, it does not prevent it.
Your Data Stays on Your Computer
A desktop app for Mac and Windows, with the interface in Turkish, English and German. Your production data is stored on your computer and analysis runs on-device. Apart from a short hourly licence ping, the update check and error reports sent only with your consent, no working data is sent; air-gapped installs switch these off too. An update takes a verified backup before it changes the database.
Face Anonymisation and Privacy Mode
Face anonymisation is chosen at import and is never automatic: the face pixels are destroyed and the video is re-encoded; the step cannot be undone and the source file is left untouched. With privacy mode on, person-based views are turned off. You can run a study without the person being identifiable.
Study Without Video: Stopwatch Study
A study without video: take the measurement with Yamazo Studio's stopwatch (Space: next element, Enter: end the cycle, Backspace: undo) or type the times into the table. You can run a study where you cannot film.
Allowance on Machine Time
For each allowance type you decide whether it also applies to machine time; a machine-controlled element takes only the allowance rows that are ticked. Default: personal and delay allowances apply, fatigue does not. Which allowance is added to machine time is your decision.
Machine-Controlled Cycle
The performance rating window shows the machine-controlled time, the operator work inside and outside machine time, the calculated idle time, the entered waiting and the load factor in one panel. The panel changes no time; it warns you if the waiting you entered differs from the calculated one.
Machine Assignment Calculator
Gives the ideal number of machines per operator from loading, machine and walking time; for the two neighbouring whole numbers it shows the cycle time and the operator and machine idle share. You choose how many machines to give an operator by comparing two whole numbers.
Precision on Periodic Elements
In stopwatch reliability, the periodic (1/X) element's own ± value and the ± value of the total cycle time are shown. If the target is missed, it does not say "reliable"; it says "Target precision not reached".
Method Section in the Report
The method section of the PDF and Excel report states the performance rating, the allowance breakdown, the target precision, the sample sufficiency, the periodic elements, the machine allowance rule, the waste and waiting, and the cycles left out of the calculation, with the reasons. How every number in the report was reached is written inside the report.
Reason Code Catalogues
Disruption, rework and breakdown reasons are kept in catalogues in Settings; a disruption reason is picked for skipped time and for interruptions. The catalogues come with ready-made reasons and are adapted to your plant. The reason for an interruption is a countable record, not free text.
Operator Qualifications
The skill matrix keeps certificates and training records per employee with their validity dates; a study freezes the qualifications of that day, and the report's method section states them. Who worked with which qualification in the study can still be read later.
Comparison
Put measured studies side by side, by assembly firm, variant or station. Choose standard, normal or observed time and a reference column; each column is its own study's time, and the difference to the reference is shown. Where a column or the reference is not reliable, the difference is marked as a hint only. Export to Excel or PDF.
Time Blocks
Build a frozen block of time from the elements of one or more studies. Enter phase, quantity, frequency and lot size, see the calculated result, then save it with a name and note. A saved block does not change; a change makes a new block.
Airlock Suggestion Box
Workers leave suggestions from their phones through a QR code printed for each location; with Airlock connected, they arrive in Studio. Turn a suggestion into a draft A3 in a project you choose, then edit it. One suggestion opens only one A3. A suggestion turned into an improvement is marked as read in the Airlock.
Approved Times
Keep the standard time per product group and station, and each product group's setup time, in one place. Prepare a draft in Studio and send it for approval; a second person releases it at the Airlock, and the signed release comes back to Studio.
Improvement Potential
See the gain of every improvement candidate on the Yamazumi: seconds per cycle, minutes per year and euros per year. It is worked out from the measured time and the hourly cost and yearly cycle count you enter; candidates are ranked by yearly gain.
Your Plant's Words
Each facility picks its own words: cell or zone instead of line, workplace or picking point instead of station. That facility's screens use them; the data stays the same.
Supplier Packs
Your supplier sends their study as a signed, encrypted pack, by file or through the Airlock. You accept the pack once on the Suppliers page and the analysis opens read-only. You invite a supplier from Studio in one click.
Pair with the Airlock by Code
Studio finds Airlocks on your local network by itself, pairs with a pairing code and, in air-gapped mode, pins the server's root certificate. When the certificate is about to expire or the Airlock's name does not resolve on your network, it warns you and says what to do.
Academy Mode
Work the Yamazo Academy labs in Studio. A link on the website opens Studio straight in that lab, in a training facility kept apart from your company data; you run the study and send the result from Studio to the Academy. The certification practical exam runs in this mode too, timed.
Manager Summary
The project PDF opens with a one-page summary: the slowest station and its output per hour, whether demand is met at the takt, the fewest people the takt needs, and the share of value-added work and waste. The workforce page also says in one sentence whether today's team meets the daily demand.
Product Tour

See Yamazo Studio in Action

Explore the intuitive interface designed for lean manufacturing professionals. From video analysis to actionable insights.
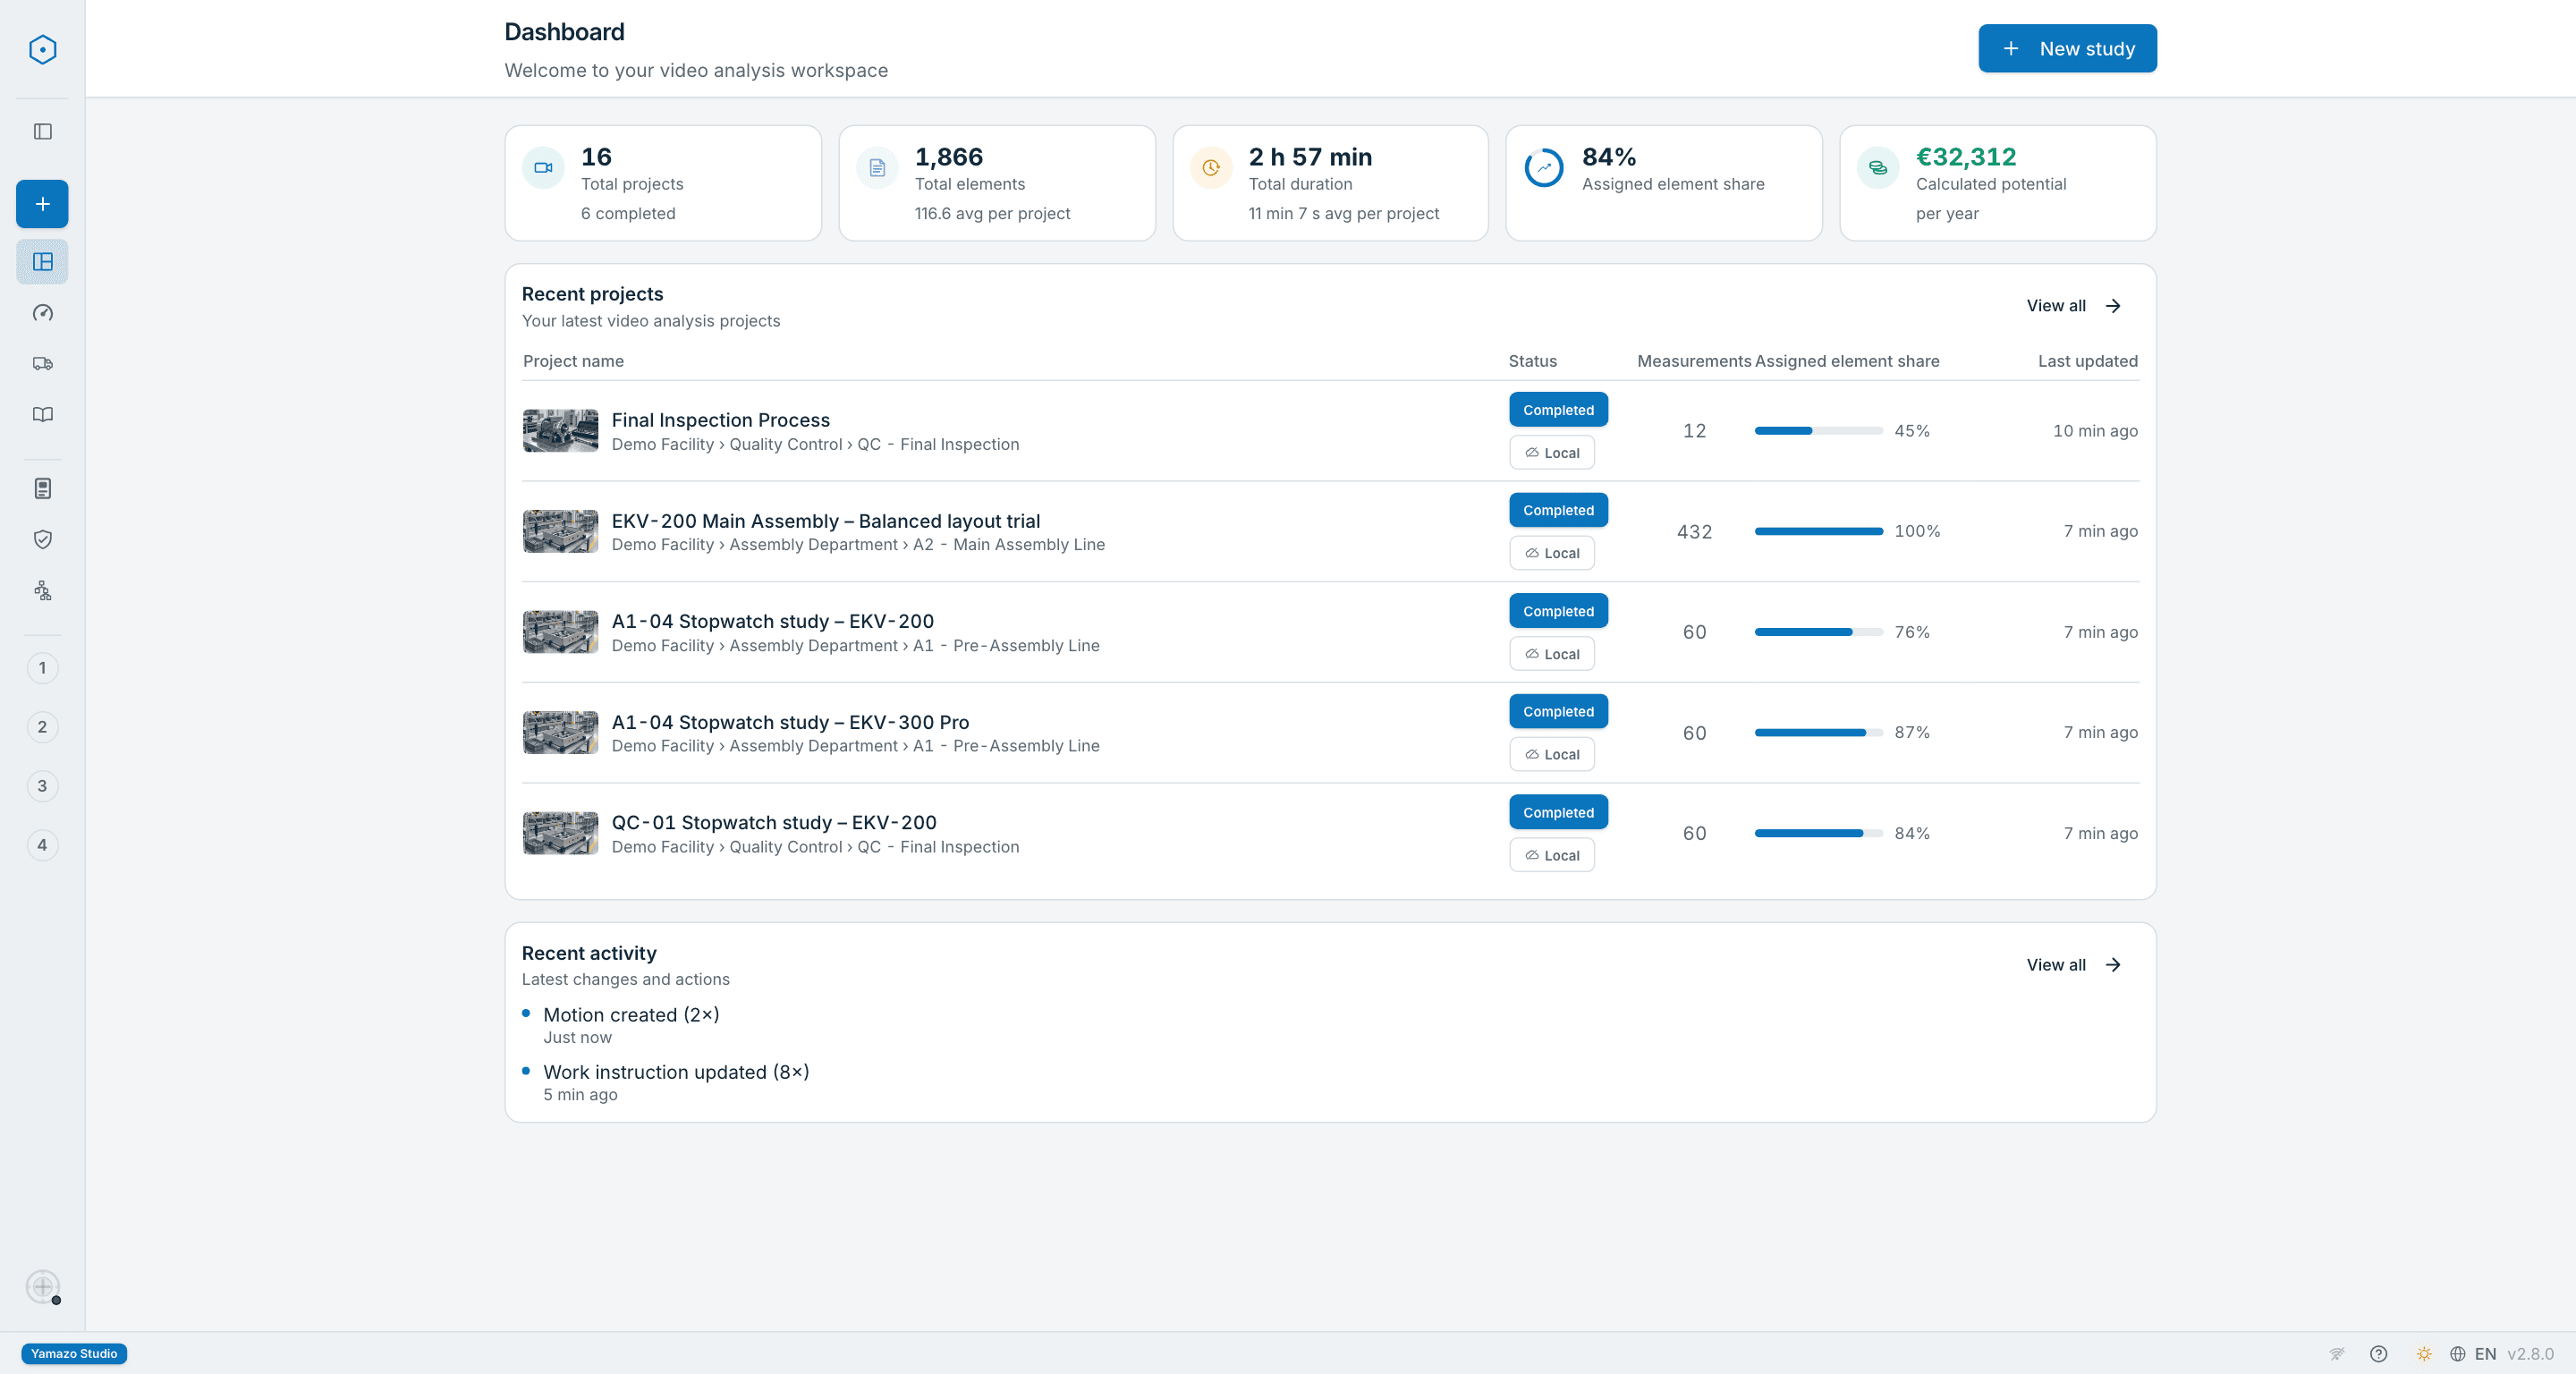
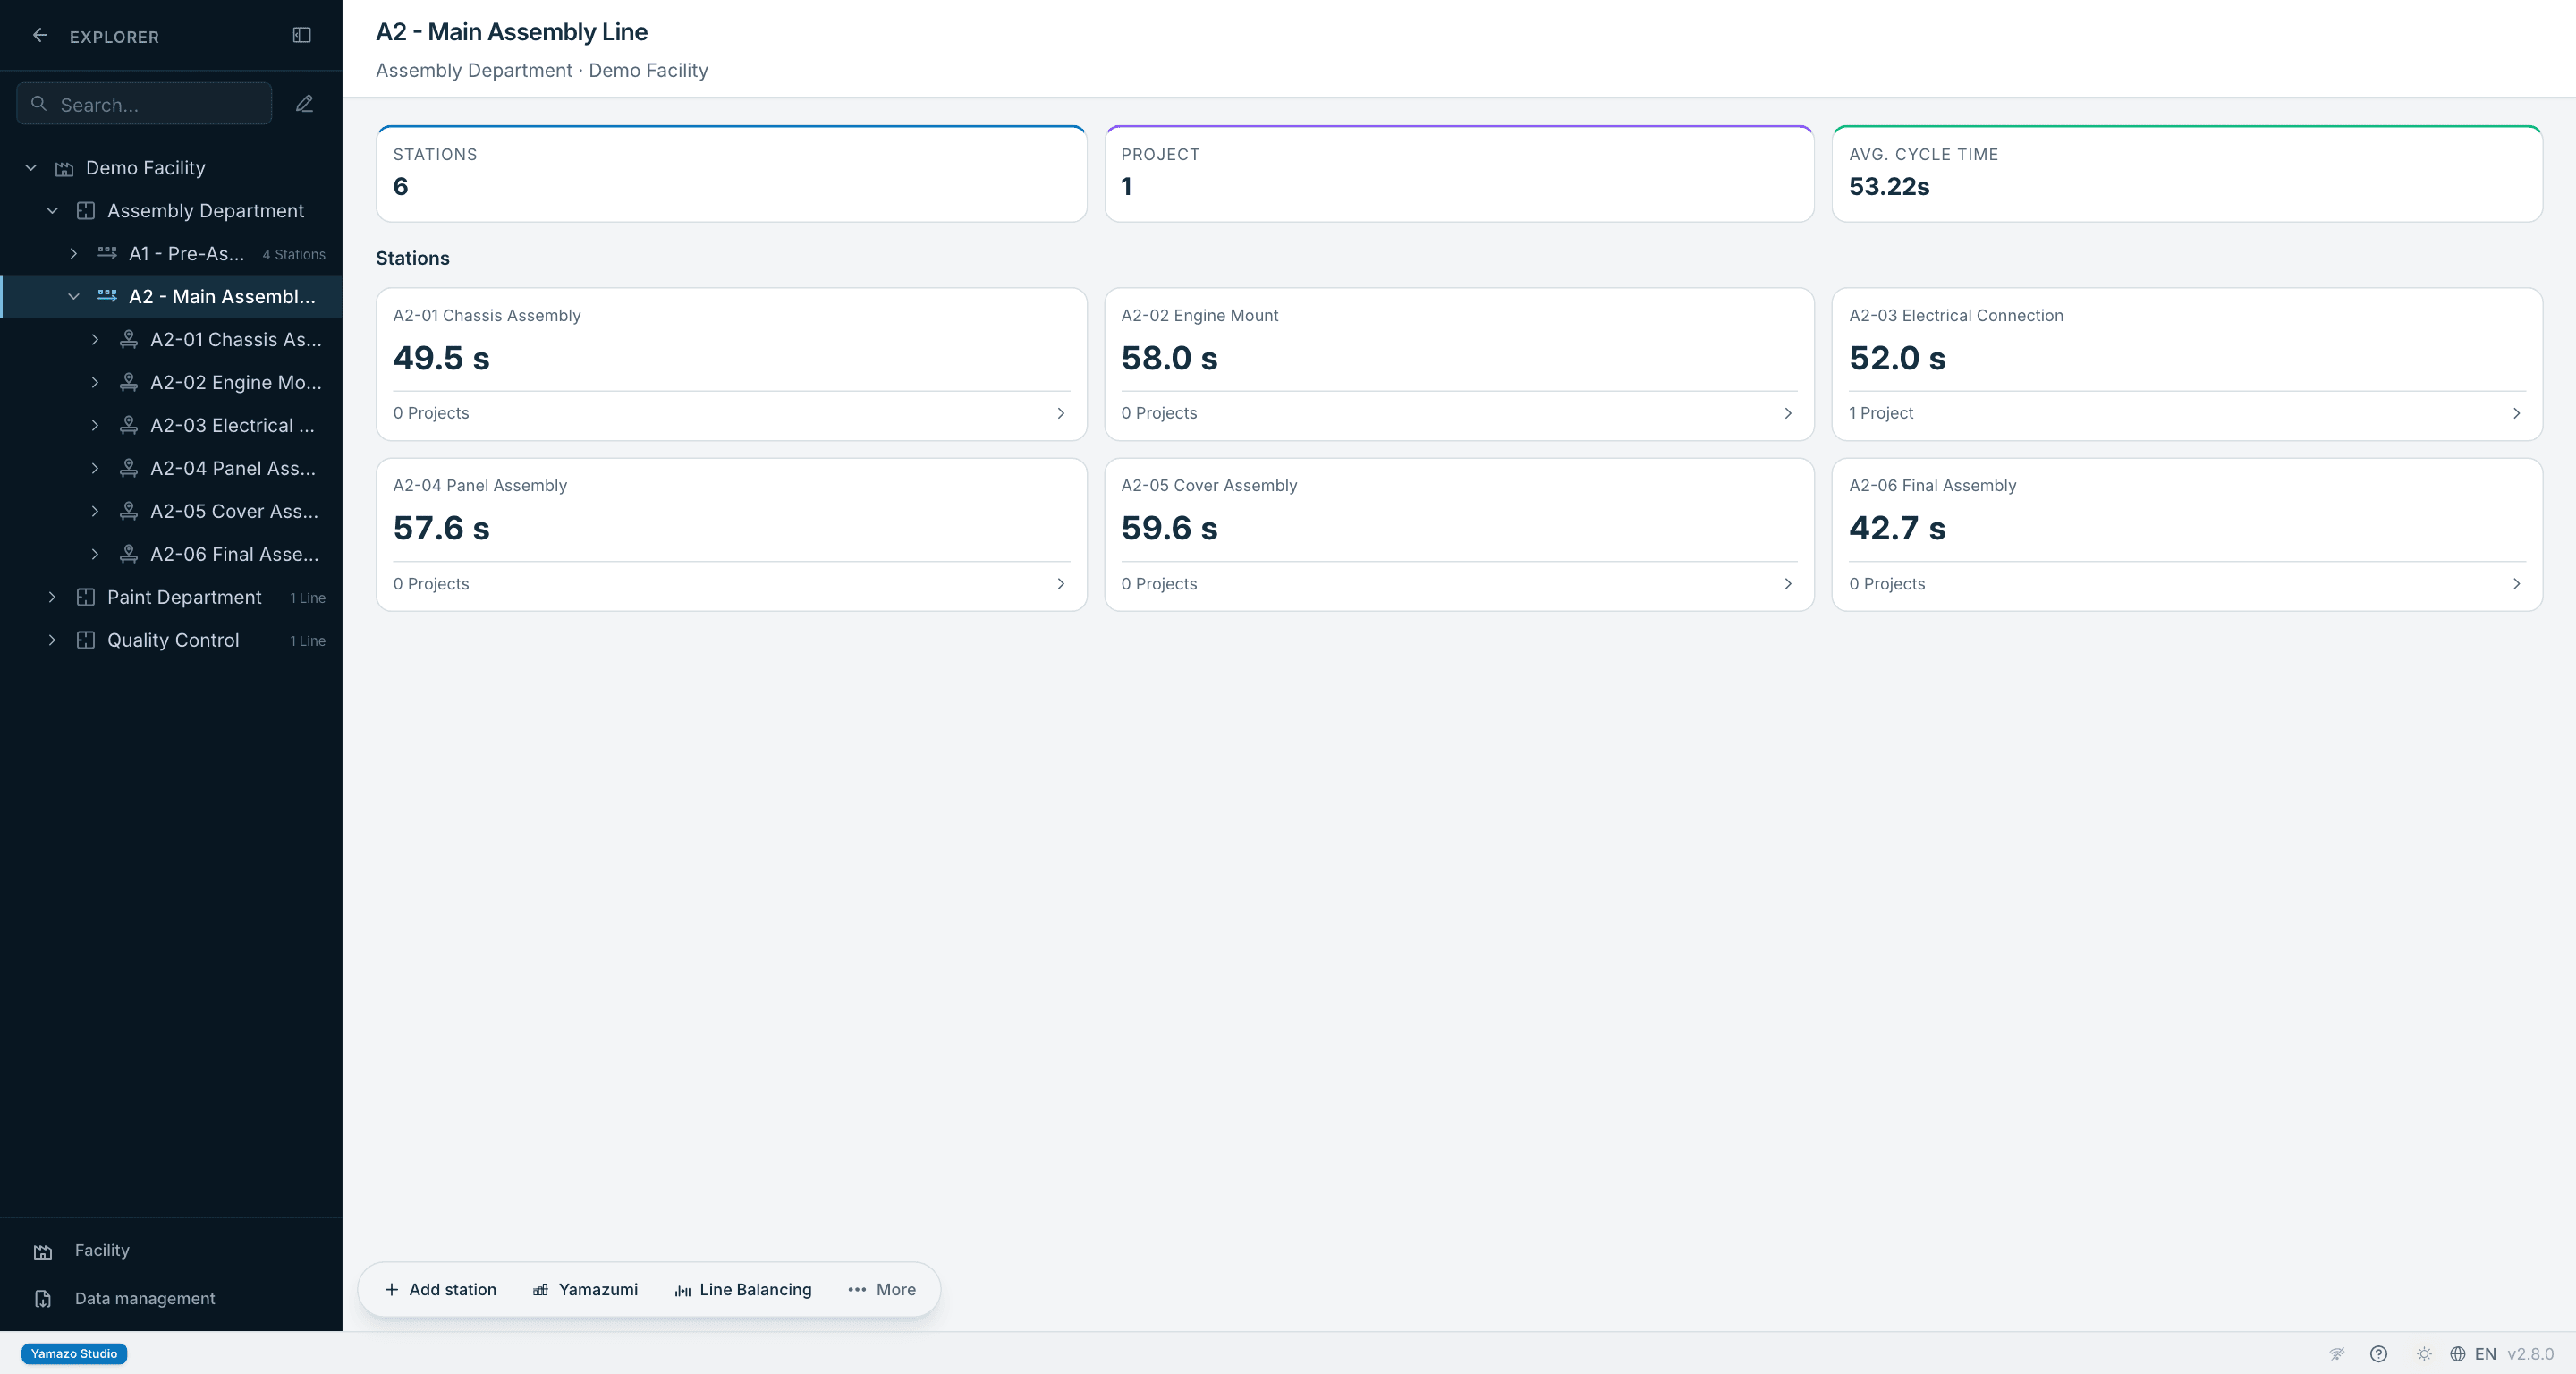
Yamazo Studio · v2.8.0
Yamazo Studio dashboard — project overview with progress tracking, completion rates, and quick access to recent video time studies
Yamazo Studio organizational explorer — facilities, departments, lines and stations in a hierarchical tree for video time study analysis
Line balancing view in Yamazo Studio — drag-and-drop workload redistribution between assembly stations to optimize cycle time
Workstation analysis screen in Yamazo Studio — detailed time distribution, operation sequence, and efficiency metrics per station
Yamazo Studio stopwatch study screen — element times per cycle, with rating and allowance per cycle
Yamazumi chart screen in Yamazo Studio — stacked bar visualization of station workload balance, takt time overlay, and bottleneck identification
Standard Operating Time (SOT) report in Yamazo Studio — multi-dimensional time analysis filterable by round, track or station, with Excel export
Yamazo Studio cycle report screen — observed, normal and standard times per work element, coefficient of variation and takt comparison, Excel and PDF export
Yamazo Studio standardized work combination table — manual, machine and walking time plotted against the takt line per station
Yamazo Studio SMED analysis screen — setup steps separated into internal and external, changeover Gantt view
Yamazo Studio WERA ergonomic screening — posture, load and repetition risk scoring on the same video as the time study
Yamazo Studio value stream mapping screen — process boxes, inventory triangles, information flow arrows and the timeline
Yamazo Studio workforce planning screen — required headcount per station for a product demand, with scenario comparison
Yamazo Studio OpEx cockpit screen — improvement portfolio, calculated annual saving and pending decisions

Dashboard

Get a bird's eye view of all your projects. Track progress, see completion rates, and access recent analyses with quick action shortcuts.

Same footage; one gives you a number, the other changes the decision.

The waste a stopwatch misses — what does it cost you by month's end?

Without Yamazo Studio
  • Measurement depends on the hours a specialist spends on the floor with a stopwatch
  • Time data lives in notebooks and spreadsheets with little context
  • Hours spent copying notes into charts and balance tables
  • Rework needed for every presentation-ready visual
  • Impossible to review motion detail once the moment has passed
  • Cannot track human–machine parallel operations accurately
  • No way to analyse multiple stations as unified timeline
  • Cloud-based alternatives need an IT security review; offline installation is rare in this category
Yamazo Studio
With Yamazo Studio
  • Multi-track: Human & machine parallel work visualisation
  • Multi-video: Analyse multiple recordings as one timeline
  • Video-synced tagging keeps context with every cycle
  • Step-by-step standard work instructions built from the recorded elements (PDF)
  • Ready-to-share reports in PDF, Excel, CSV and JSON; value stream maps also as PowerPoint
  • Granular motion playback to verify each improvement
  • IT-friendly: runs without internet, your videos stay on your computer
  • The labour time in your quotes rests on the same measurement

Simple Deployment, Powerful Analysis

Desktop application for Mac and Windows. Download the demo and try with your own video — runs the analysis entirely on your device. Available as an annual license.

1

Download demo and try with your own video

2

Receive custom pricing proposal

3

Purchase license for your operation

4

Deploy and activate on your systems

Mac (M1+) and Windows 10/11

Runs on standard office computers. See documentation for detailed system requirements.